
Optimism price prediction: further volatility ahead? OP gains 8.04% within key range

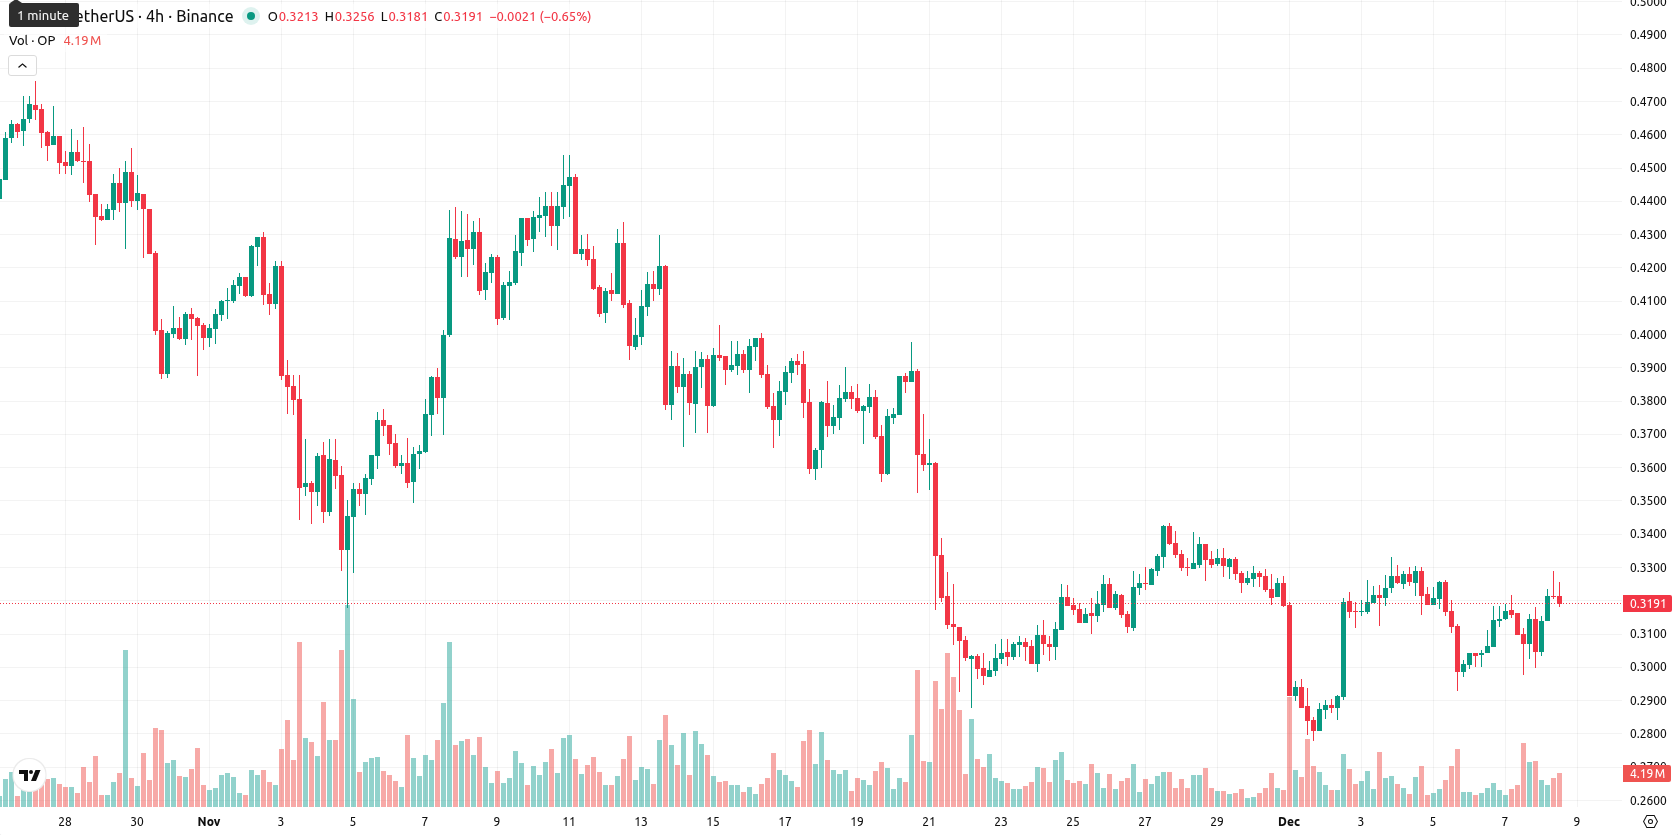
Optimism (OP) is trading at $0.3239, matching its MA-20 level after an 8.04% intraday advance. However, the asset remains pressured below both the MA-50 ($0.3769) and MA-200 ($0.5999) averages, underscoring a prevailing bearish technical background.
Highlights
- OP is trading at $0.3239, matching its MA-20 but remaining below MA-50 ($0.3769) and MA-200 ($0.5999), signaling continued medium- and long-term bearish pressure.
- Momentum indicators are bearish with MACD and ADX showing further downside bias, while RSI (39.9) and CCI (–66.5) confirm seller dominance without clear oversold conditions.
- OP's price is expected to remain range-bound between $0.305 and $0.355 over the next five days, with less than 20% probability of an upward breakout.
Choppy momentum persists as resistance and oscillators diverge
The nearest dynamic resistance on the daily chart is at the Ichimoku Kijun ($0.3556), while the main support sits at the MA-20 and today’s intraday low. Technical momentum remains soft, with both the MACD and ADX on the daily chart pointing to continued downside and a lack of clear uptrend. The RSI at 39.9 and CCI at –66.5 indicate sellers are still dominant — yet not fully oversold — with Stoch RSI (74.6) demonstrating lingering overbought conditions, signaling divergence among oscillators. Bull/Bear Power shows a slight intraday buy signal, consistent with the session's robust move to the upper end of today's range, but overall, mixed momentum and oscillator readings suggest potential for choppy action ahead.
Muted breakout odds as volatility remains range-bound
Looking ahead, OP is expected to remain volatile but largely constrained within a typical volatility band from $0.305 to $0.355 over the next five trading days. The likelihood of an upward breakout above $0.355 is low (under 20%); range-bound trade or renewed downside are therefore favored unless a decisive shift in volumes emerges. A bullish scenario would require a strong close above resistance, while dropping below $0.305 could prompt a fresh wave of selling. The baseline expectation is continued sideways movement within these key levels.
Previously it was reported that Optimism remained under strong short-, medium-, and long-term bearish pressure, trading below its key moving averages and with technical signals such as MACD and ADX highlighting persistent negative momentum. Despite oversold readings on RSI and other oscillators suggesting sellers may be exhausted, the market bias stayed sideways to lower, with the expected range set at $0.2700 – $0.3300 for the coming days and low prospects for a near-term rebound.


-
 Afghanistan
-
 Albania
-
 Algeria
-
 Angola
-
 Argentina
-
 Armenia
-
 Australia
-
 Austria
-
 Azerbaijan
-
 Bahamas
-
 Bahrain
-
 Bangladesh
-
 Belarus
-
 Belgium
-
 Bolivia
-
 Botswana
-
 Brazil
-
 Brunei
-
 Bulgaria
-
 Cambodia
-
 Cameroon
-
 Canada
-
 Chile
Chile
-
 China
China
-
 Colombia
-
 Congo
Congo
-
 Costa Rica
-
 Cote d'Ivoire
-
 Croatia
-
 Cuba
Cuba
-
 Cyprus
-
 Czechia
-
 DR Congo
-
 Denmark
-
 Dominican Republic
-
 Ecuador
-
 Egypt
Egypt
-
 El Salvador
-
 Estonia
-
 Eswatini
-
 Ethiopia
-
 Finland
-
 France
-
 Georgia
-
 Germany
-
 Ghana
Ghana
-
 Greece
-
 Haiti
Haiti
-
 Hong Kong
-
 Hungary
-
 India
India
-
 Indonesia
-
 Iran, Islamic republic
-
 Iraq
Iraq
-
 Ireland
-
 Israel
-
 Italy
Italy
-
 Jamaica
-
 Japan
Japan
-
 Jordan
-
 Kazakhstan
-
 Kenya
Kenya
-
 Korea
Korea
-
 Kuwait
-
 Kyrgyzstan
-
 Laos
Laos
-
 Latvia
-
 Lebanon
-
 Lesotho
-
 Libya
Libya
-
 Lithuania
-
 Luxembourg
-
 Madagascar
-
 Malaysia
-
 Malta
Malta
-
 Mauritius
-
 Mexico
-
 Moldova
-
 Mongolia
-
 Montenegro
-
 Morocco
-
 Mozambique
-
 Myanmar
-
 Namibia
-
 Nepal
Nepal
-
 Netherlands
-
 New Zealand
-
 Nigeria
-
 North Macedonia
-
 Norway
-
 Oman
Oman
-
 Pakistan
-
 Palestine
-
 Panama
-
 Papua New Guinea
-
 Paraguay
-
 Peru
Peru
-
 Philippines
-
 Poland
-
 Portugal
-
 Puerto Rico
-
 Qatar
Qatar
-
 Reunion
-
 Romania
-
 Rwanda
-
 Saudi Arabia
-
 Serbia
-
 Singapore
-
 Slovakia
-
 Slovenia
-
 Somalia
-
 South Africa
-
 Spain
Spain
-
 Sri Lanka
-
 Sweden
-
 Switzerland
-
 Syria
Syria
-
 Taiwan
-
 Tajikistan
-
 Tanzania
-
 Thailand
-
 Trinidad and Tobago
-
 Tunisia
-
 Turkey
-
 UAE
UAE
-
 Uganda
-
 Ukraine
-
 United Kingdom
-
United States
-
 Uruguay
-
 Uzbekistan
-
 Venezuela
-
 Vietnam
-
 Yemen
Yemen
-
 Zambia
-
 Zimbabwe
- Forex
- Crypto
