
Optimism slips 7.10% after persistent technical weakness and strong selling pressure

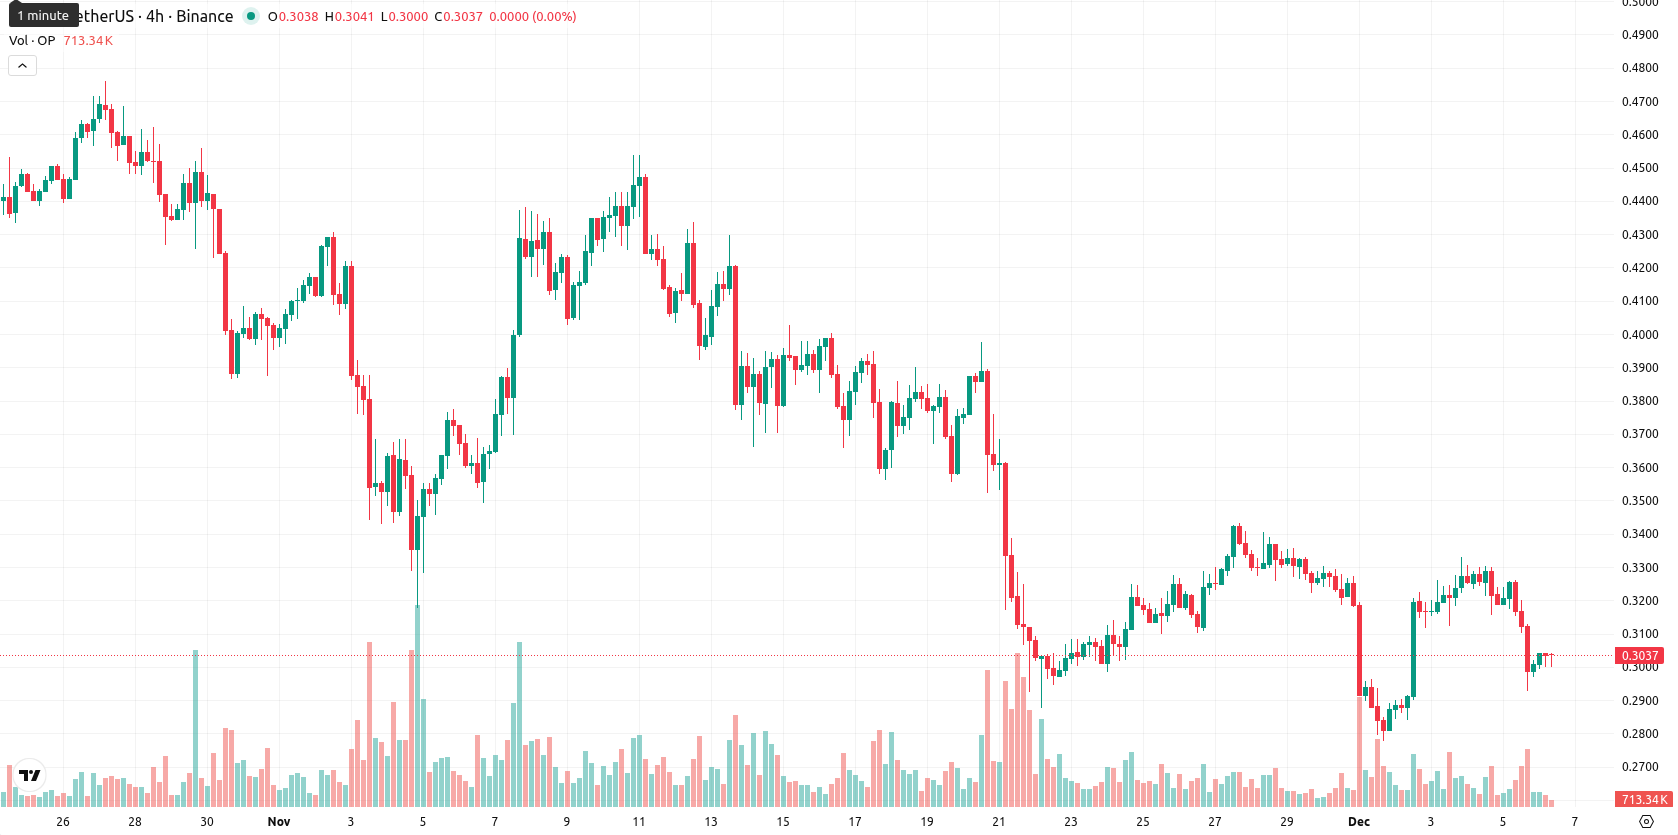
Optimism (OP) is trading at $0.3023, marking a daily slide of 7.10%. The price sits firmly below the MA-20 ($0.3304), MA-50 ($0.3814), and MA-200 ($0.6041), confirming strong short-, medium-, and long-term bearish pressure.
Highlights
- OP trades at $0.3023, significantly below the MA-20 ($0.3304), MA-50 ($0.3814), and MA-200 ($0.6041), confirming strong bearish momentum across all timeframes.
- Technical indicators show persistent downside, with MACD issuing a strong sell, ADX elevated, and intraday volatility high as OP declines 7.10% today to test $0.2993 support.
- Short-term probability of price increase remains below 20%, with expected trading range at $0.2700–$0.3300 and a bearish scenario favored if OP closes below $0.2990.
Oversold signals emerge as downside momentum and resistance converge
From a technical perspective, the nearest major resistance is defined by the Ichimoku Kijun at $0.3658, with immediate support at the session low near $0.2993. Momentum indicators remain negative, with MACD on a strong sell signal and an elevated ADX on D1, confirming downside trend strength. RSI (37.8), Stoch RSI, and CCI all show oversold conditions, suggesting seller control is moderating and the market may be nearing exhaustion, while BBP points to some intraday buyer interest. There is divergence between oversold oscillators and persistently weak momentum, which points to the potential for a pause rather than a reversal.
Sideways or lower bias expected as volatility and bearish risks persist
For the next five trading days, the expected range is set at $0.2700 – $0.3300, reflecting the typical volatility band relative to current levels and the prevailing bearish mood. The chance of a price rise in the short term is low, at less than 20%, so a further decline is more likely. The baseline scenario calls for sideways movement within this corridor, while a bullish case would require the price to regain and stabilize above the $0.3300 – $0.3658 resistance area. Closing decisively below $0.2990 would confirm a bearish scenario and open up further downside within the new support range.
Previously it was reported that Optimism is trading well below its key moving averages across all timeframes, with negative momentum indicators like MACD and ADX confirming ongoing bearish pressure. Resistance remains near the Ichimoku Kijun and oscillators show mixed short-term signals, while sellers are expected to set a consolidation range as intraday volatility and clear pressure dominate the outlook.


-
 Afghanistan
-
 Albania
-
 Algeria
-
 Angola
-
 Argentina
-
 Armenia
-
 Australia
-
 Austria
-
 Azerbaijan
-
 Bahamas
-
 Bahrain
-
 Bangladesh
-
 Belarus
-
 Belgium
-
 Bolivia
-
 Botswana
-
 Brazil
-
 Brunei
-
 Bulgaria
-
 Cambodia
-
 Cameroon
-
 Canada
-
 Chile
Chile
-
 China
China
-
 Colombia
-
 Congo
Congo
-
 Costa Rica
-
 Cote d'Ivoire
-
 Croatia
-
 Cuba
Cuba
-
 Cyprus
-
 Czechia
-
 DR Congo
-
 Denmark
-
 Dominican Republic
-
 Ecuador
-
 Egypt
Egypt
-
 El Salvador
-
 Estonia
-
 Eswatini
-
 Ethiopia
-
 Finland
-
 France
-
 Georgia
-
 Germany
-
 Ghana
Ghana
-
 Greece
-
 Haiti
Haiti
-
 Hong Kong
-
 Hungary
-
 India
India
-
 Indonesia
-
 Iran, Islamic republic
-
 Iraq
Iraq
-
 Ireland
-
 Israel
-
 Italy
Italy
-
 Jamaica
-
 Japan
Japan
-
 Jordan
-
 Kazakhstan
-
 Kenya
Kenya
-
 Korea
Korea
-
 Kuwait
-
 Kyrgyzstan
-
 Laos
Laos
-
 Latvia
-
 Lebanon
-
 Lesotho
-
 Libya
Libya
-
 Lithuania
-
 Luxembourg
-
 Madagascar
-
 Malaysia
-
 Malta
Malta
-
 Mauritius
-
 Mexico
-
 Moldova
-
 Mongolia
-
 Montenegro
-
 Morocco
-
 Mozambique
-
 Myanmar
-
 Namibia
-
 Nepal
Nepal
-
 Netherlands
-
 New Zealand
-
 Nigeria
-
 North Macedonia
-
 Norway
-
 Oman
Oman
-
 Pakistan
-
 Palestine
-
 Panama
-
 Papua New Guinea
-
 Paraguay
-
 Peru
Peru
-
 Philippines
-
 Poland
-
 Portugal
-
 Puerto Rico
-
 Qatar
Qatar
-
 Reunion
-
 Romania
-
 Rwanda
-
 Saudi Arabia
-
 Serbia
-
 Singapore
-
 Slovakia
-
 Slovenia
-
 Somalia
-
 South Africa
-
 Spain
Spain
-
 Sri Lanka
-
 Sweden
-
 Switzerland
-
 Syria
Syria
-
 Taiwan
-
 Tajikistan
-
 Tanzania
-
 Thailand
-
 Trinidad and Tobago
-
 Tunisia
-
 Turkey
-
 UAE
UAE
-
 Uganda
-
 Ukraine
-
 United Kingdom
-
United States
-
 Uruguay
-
 Uzbekistan
-
 Venezuela
-
 Vietnam
-
 Yemen
Yemen
-
 Zambia
-
 Zimbabwe
- Forex
- Crypto
