
Bearish technical signals deepen — The Graph slumps 9.13%

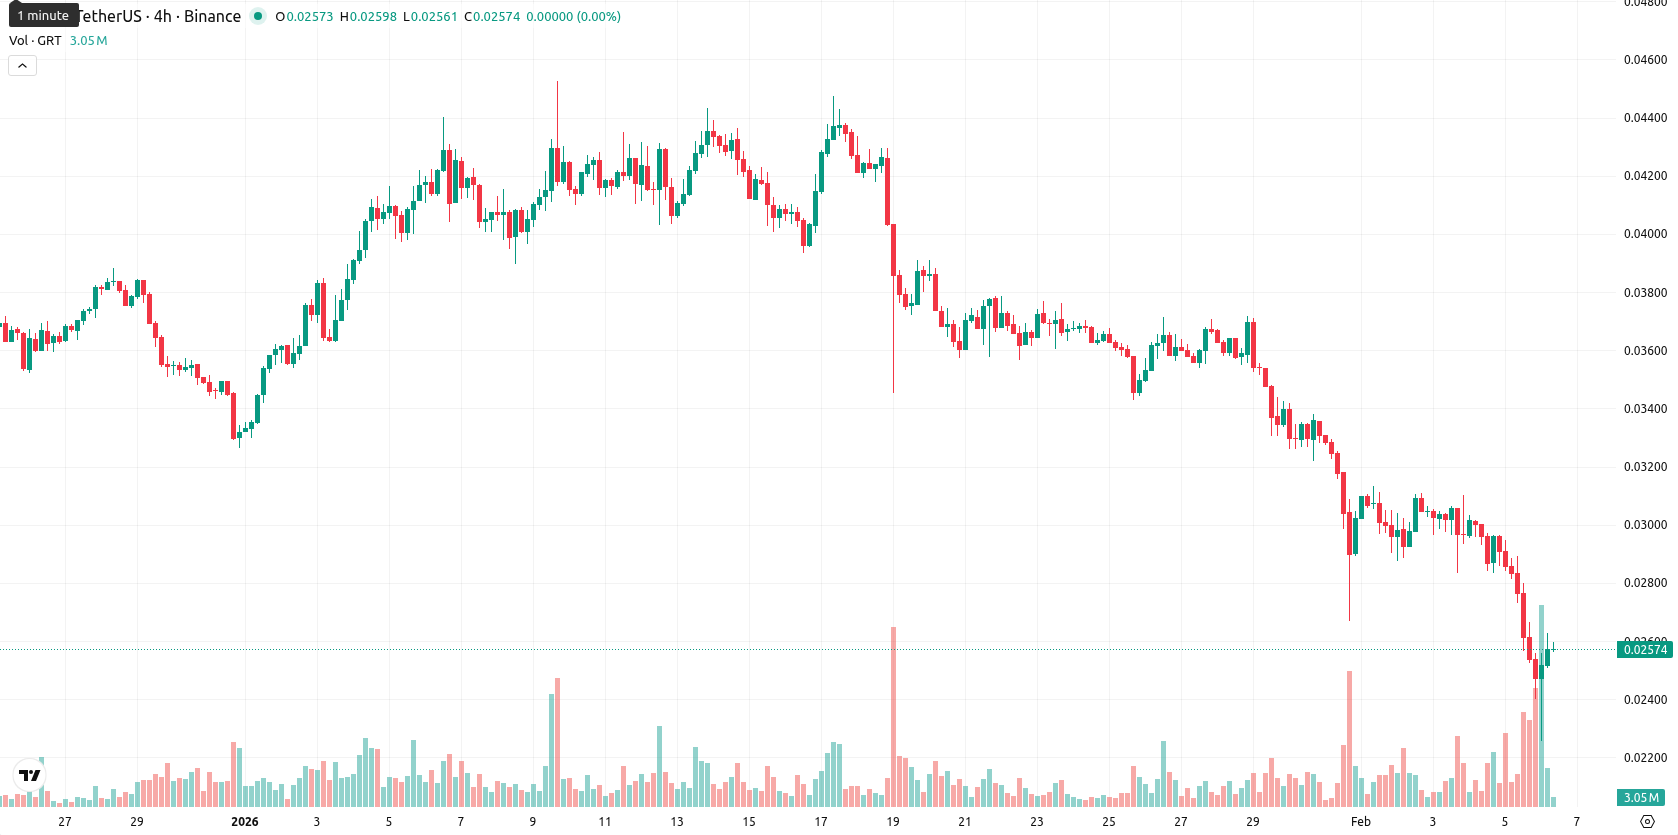
The Graph (GRT) is trading at $0.02589, showing a sharp daily decline of 9.13%. The current price remains well below the MA-20 at $0.034512, MA-50 at $0.037057, and MA-200 at $0.066137, confirming clear seller dominance across all timeframes.
Highlights
- GRT price at $0.02589 is trading well below its MA-20 ($0.034512), MA-50 ($0.037057), and MA-200 ($0.066137), confirming broad seller dominance across all timeframes.
- Momentum indicators, including MACD, ADX, and Awesome Oscillator, remain bearish, while RSI (23.42) and CCI (-164.13) confirm deeply oversold conditions alongside a fully oversold Stochastic RSI.
- Key resistance is at the Ichimoku Kijun level of $0.034405; immediate support is absent, with risk of decline below $0.02300 and limited rebound probability (<20%) in the next five days.
Oversold signals compound risk as resistance blocks recovery
Technically, GRT faces strong overhead resistance at the Ichimoku Kijun level of $0.034405, and there is no significant immediate support below its present price. Momentum indicators such as the MACD and ADX suggest the bearish trend is likely to persist. Deeply negative readings from the RSI (23.42), Commodity Channel Index (-164.13), and fully oversold Stochastic RSI all indicate extreme oversold territory. The Bull/Bear Power metric favors sellers intraday, while the Awesome Oscillator confirms pronounced downward pressure.
Downside bias prevails as volatility narrows rebound odds
Over the next five trading days, GRT is expected to fluctuate within a typical volatility band of $0.02300 – $0.02800 given the current environment. The probability of further upside remains low at under 20%, favoring continued declines or sideways consolidation near current levels. A sustained move above $0.03440 could trigger a rebound to $0.02800 or beyond, but as long as persistent bearish signals dominate, breaking below $0.02300 could expose the asset to fresh lows.
Previously it was reported that The Graph is exhibiting sustained bearish momentum, trading well below its major moving averages with multiple technical indicators—including MACD, ADX, and the Awesome Oscillator—confirming continued downside strength and seller control. While oversold readings on the RSI, CCI, and Stochastic RSI suggest the possibility of a short-term bounce from support, prevailing resistance at the Ichimoku Kijun level and weak trend strength limit the likelihood of a significant recovery.


-
 Afghanistan
-
 Albania
-
 Algeria
-
 Angola
-
 Argentina
-
 Armenia
-
 Australia
-
 Austria
-
 Azerbaijan
-
 Bahamas
-
 Bahrain
-
 Bangladesh
-
 Belarus
-
 Belgium
-
 Bolivia
-
 Botswana
-
 Brazil
-
 Brunei
-
 Bulgaria
-
 Cambodia
-
 Cameroon
-
 Canada
-
 Chile
Chile
-
 China
China
-
 Colombia
-
 Congo
Congo
-
 Costa Rica
-
 Cote d'Ivoire
-
 Croatia
-
 Cuba
Cuba
-
 Cyprus
-
 Czechia
-
 DR Congo
-
 Denmark
-
 Dominican Republic
-
 Ecuador
-
 Egypt
Egypt
-
 El Salvador
-
 Estonia
-
 Eswatini
-
 Ethiopia
-
 Finland
-
 France
-
 Georgia
-
 Germany
-
 Ghana
Ghana
-
 Greece
-
 Haiti
Haiti
-
 Hong Kong
-
 Hungary
-
 India
India
-
 Indonesia
-
 Iran, Islamic republic
-
 Iraq
Iraq
-
 Ireland
-
 Israel
-
 Italy
Italy
-
 Jamaica
-
 Japan
Japan
-
 Jordan
-
 Kazakhstan
-
 Kenya
Kenya
-
 Korea
Korea
-
 Kuwait
-
 Kyrgyzstan
-
 Laos
Laos
-
 Latvia
-
 Lebanon
-
 Lesotho
-
 Libya
Libya
-
 Lithuania
-
 Luxembourg
-
 Madagascar
-
 Malaysia
-
 Malta
Malta
-
 Mauritius
-
 Mexico
-
 Moldova
-
 Mongolia
-
 Montenegro
-
 Morocco
-
 Mozambique
-
 Myanmar
-
 Namibia
-
 Nepal
Nepal
-
 Netherlands
-
 New Zealand
-
 Nigeria
-
 North Macedonia
-
 Norway
-
 Oman
Oman
-
 Pakistan
-
 Palestine
-
 Panama
-
 Papua New Guinea
-
 Paraguay
-
 Peru
Peru
-
 Philippines
-
 Poland
-
 Portugal
-
 Puerto Rico
-
 Qatar
Qatar
-
 Reunion
-
 Romania
-
 Rwanda
-
 Saudi Arabia
-
 Serbia
-
 Singapore
-
 Slovakia
-
 Slovenia
-
 Somalia
-
 South Africa
-
 Spain
Spain
-
 Sri Lanka
-
 Sweden
-
 Switzerland
-
 Syria
Syria
-
 Taiwan
-
 Tajikistan
-
 Tanzania
-
 Thailand
-
 Trinidad and Tobago
-
 Tunisia
-
 Turkey
-
 UAE
UAE
-
 Uganda
-
 Ukraine
-
 United Kingdom
-
United States
-
 Uruguay
-
 Uzbekistan
-
 Venezuela
-
 Vietnam
-
 Yemen
Yemen
-
 Zambia
-
 Zimbabwe
- Forex
- Crypto
