
The Graph price prediction: Rangebound action ahead? GRT gains 7.07%

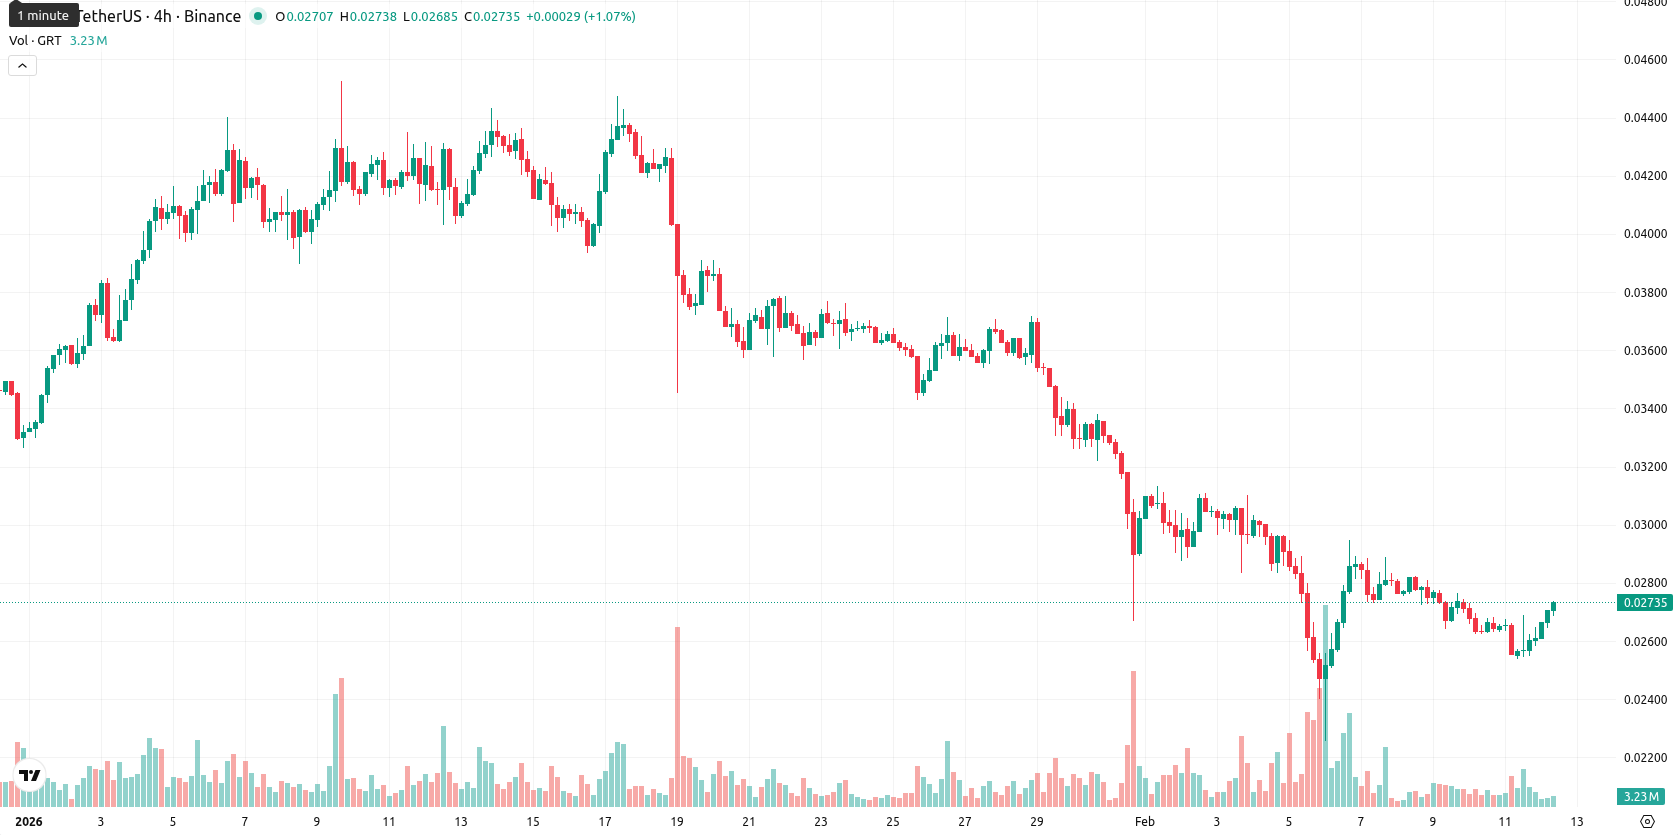
The Graph (GRT) is trading below the MA-20 ($0.031141), MA-50 ($0.035885), and MA-200 ($0.063739) moving averages, underscoring established bearish pressure across short-, medium-, and long-term timeframes. On the day, GRT has gained 7.07%, reaching $0.027357, opening slightly higher than the previous close and approaching session highs amid increased intraday volatility and a shift toward buying pressure.
Highlights
- GRT/USD remains below the MA-20 ($0.031141), MA-50 ($0.035885), and MA-200 ($0.063739), confirming persistent bearish momentum across all major timeframes.
- Momentum indicators are negative on the daily with MACD and ADX confirming a bearish trend, while RSI (31.78) signals oversold conditions and short-term volatility.
- A consolidation band between $0.0268–$0.0277 is expected for the coming week, with less than a 20% probability of a price rebound; breakdown below $0.0268 reinforces the bearish scenario.
Bearish momentum persists as oversold signals and volatility diverge
Technically, GRT/USD remains in a bearish pattern with the price trading well below its nearest dynamic resistance and support, the Ichimoku Kijun at $0.033645. Daily momentum remains negative, as MACD and ADX both confirm ongoing bearish strength, and both RSI (31.78) and CCI indicate oversold conditions. The Stochastic RSI at 63.66 suggests a potential short-term rebound, but Bull/Bear Power stays negative, supporting clear intraday dominance by sellers. A divergence is noted between short-term momentum and longer-term oscillators, hinting at possible near-term volatility while the overall backdrop remains weak.
Downside risk prevails as consolidation expected within narrow band
For the coming week, GRT is expected to consolidate within the typical volatility band of $0.0268–$0.0277, with less than a 20% chance of upward movement. The likelihood of a further decline is elevated, as all key weekly indicators — MA-50, RSI, ADX, and MACD — remain bearish. The baseline scenario projects sideways action within this range. A close above $0.0277 could prompt a push to higher resistance levels, while persistent weakness below $0.0268 would reinforce the prevailing downtrend.
Previously it was reported that The Graph remains decisively below all major moving averages with bearish weekly momentum, as indicators like RSI, CCI, and MACD show persistent negative pressure and weak reversal signals. The asset is expected to consolidate within a narrow range near key support and resistance, with limited breakout risk and ongoing seller dominance.


-
 Afghanistan
-
 Albania
-
 Algeria
-
 Angola
-
 Argentina
-
 Armenia
-
 Australia
-
 Austria
-
 Azerbaijan
-
 Bahamas
-
 Bahrain
-
 Bangladesh
-
 Belarus
-
 Belgium
-
 Bolivia
-
 Botswana
-
 Brazil
-
 Brunei
-
 Bulgaria
-
 Cambodia
-
 Cameroon
-
 Canada
-
 Chile
Chile
-
 China
China
-
 Colombia
-
 Congo
Congo
-
 Costa Rica
-
 Cote d'Ivoire
-
 Croatia
-
 Cuba
Cuba
-
 Cyprus
-
 Czechia
-
 DR Congo
-
 Denmark
-
 Dominican Republic
-
 Ecuador
-
 Egypt
Egypt
-
 El Salvador
-
 Estonia
-
 Eswatini
-
 Ethiopia
-
 Finland
-
 France
-
 Georgia
-
 Germany
-
 Ghana
Ghana
-
 Greece
-
 Haiti
Haiti
-
 Hong Kong
-
 Hungary
-
 India
India
-
 Indonesia
-
 Iran, Islamic republic
-
 Iraq
Iraq
-
 Ireland
-
 Israel
-
 Italy
Italy
-
 Jamaica
-
 Japan
Japan
-
 Jordan
-
 Kazakhstan
-
 Kenya
Kenya
-
 Korea
Korea
-
 Kuwait
-
 Kyrgyzstan
-
 Laos
Laos
-
 Latvia
-
 Lebanon
-
 Lesotho
-
 Libya
Libya
-
 Lithuania
-
 Luxembourg
-
 Madagascar
-
 Malaysia
-
 Malta
Malta
-
 Mauritius
-
 Mexico
-
 Moldova
-
 Mongolia
-
 Montenegro
-
 Morocco
-
 Mozambique
-
 Myanmar
-
 Namibia
-
 Nepal
Nepal
-
 Netherlands
-
 New Zealand
-
 Nigeria
-
 North Macedonia
-
 Norway
-
 Oman
Oman
-
 Pakistan
-
 Palestine
-
 Panama
-
 Papua New Guinea
-
 Paraguay
-
 Peru
Peru
-
 Philippines
-
 Poland
-
 Portugal
-
 Puerto Rico
-
 Qatar
Qatar
-
 Reunion
-
 Romania
-
 Rwanda
-
 Saudi Arabia
-
 Serbia
-
 Singapore
-
 Slovakia
-
 Slovenia
-
 Somalia
-
 South Africa
-
 Spain
Spain
-
 Sri Lanka
-
 Sweden
-
 Switzerland
-
 Syria
Syria
-
 Taiwan
-
 Tajikistan
-
 Tanzania
-
 Thailand
-
 Trinidad and Tobago
-
 Tunisia
-
 Turkey
-
 UAE
UAE
-
 Uganda
-
 Ukraine
-
 United Kingdom
-
United States
-
 Uruguay
-
 Uzbekistan
-
 Venezuela
-
 Vietnam
-
 Yemen
Yemen
-
 Zambia
-
 Zimbabwe
- Forex
- Crypto
