
GRT drops 3.05% as bearish momentum persists below all major moving averages and support at $0.02640 – weekly outlook

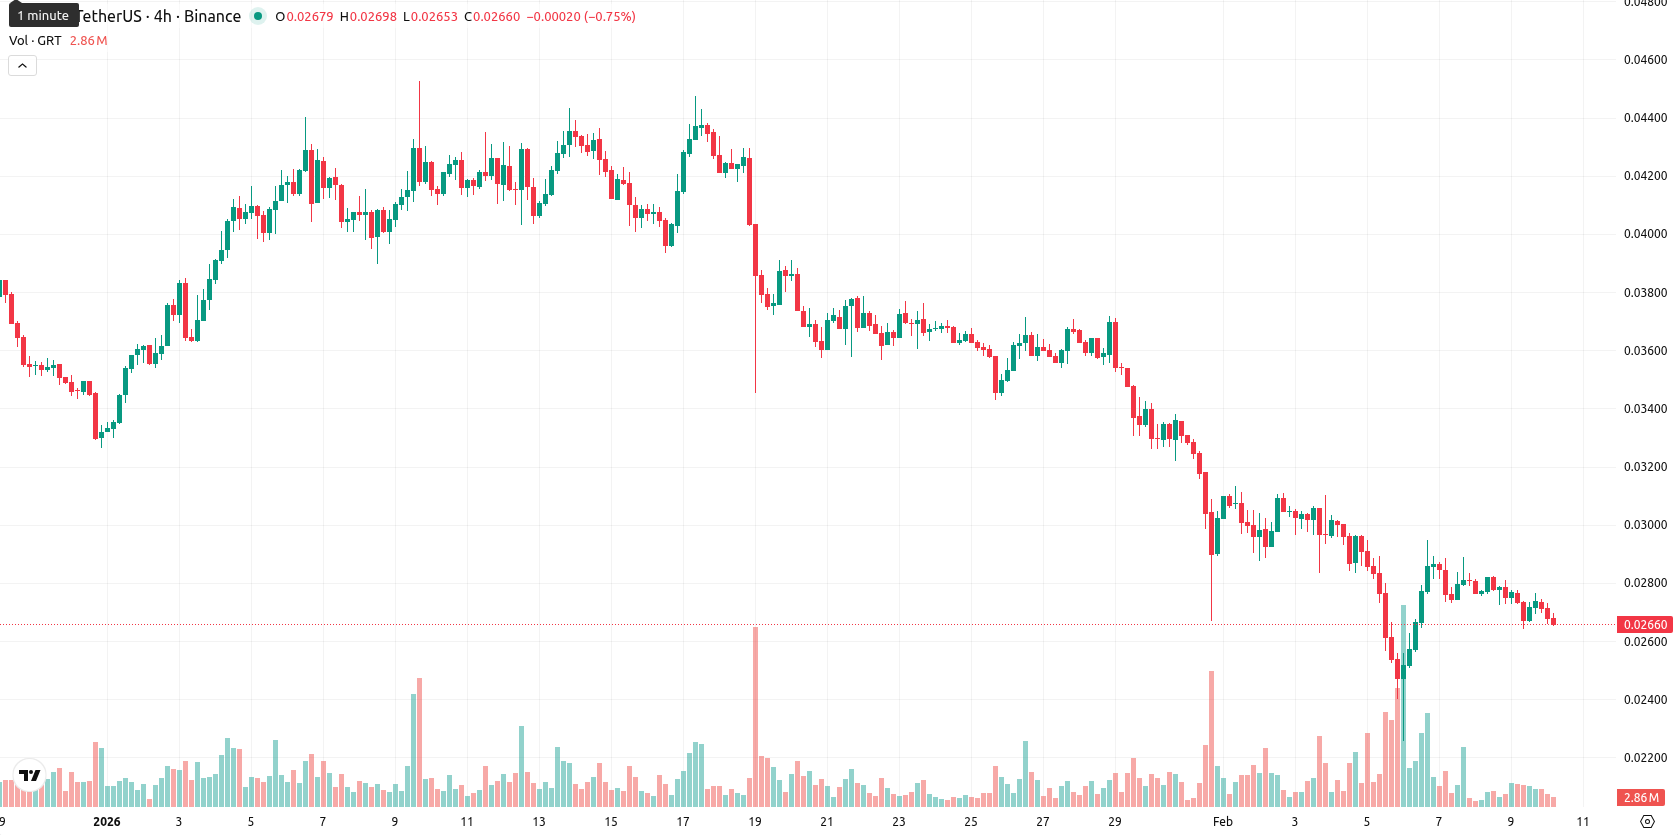
The Graph (GRT) is trading at $0.02657, marking a weekly move that keeps it well below its major moving averages: MA-20 at $0.03218, MA-50 at $0.03632, and MA-200 at $0.06453. This places GRT decisively under short-, medium-, and long-term weekly trend levels, confirming a sustained bearish outlook for the past week.
Highlights
- GRT trades at $0.02657, remaining firmly below all major moving averages (MA-20 at $0.03218, MA-50 at $0.03632, MA-200 at $0.06453), confirming persistent downward momentum across timeframes.
- Bearish signals dominate as MACD, ADX, Bull/Bear Power, and Awesome Oscillator reinforce a sell bias, while RSI at 33.86 and CCI at –91.39 indicate oversold conditions without clear reversal signs.
- For the coming week, the anticipated trading range is tight at $0.02640–$0.02729, with a less than 20% probability of upward price movement and prevailing risk of further decline or stagnation.
Bearish technical momentum deepens as indicators trend near oversold
On the weekly chart, GRT remains below all key moving averages, with the closest resistance levels at the MA-20 ($0.03218) and the Ichimoku Kijun ($0.03365). Momentum remains strongly negative: the weekly RSI stands at 33.86, close to oversold territory, while the CCI at –91.39 and a neutral Stochastic RSI signal a lack of bullish reversal signals. Both the MACD and ADX reinforce the current sell bias, while weekly Bull/Bear Power and the Awesome Oscillator confirm ongoing seller dominance. Support is seen just below the current price at $0.02640, with stronger resistance above at $0.02729 and $0.03365.
Tight range consolidation likely as breakout risk remains subdued this week
Looking ahead to the next five to seven trading days, GRT is expected to consolidate within a tight range between $0.02640 and $0.02729, as signaled by weekly moving averages and momentum indicators. The base case scenario favors sideways movement with limited volatility, and chances of a significant breakout are low. A sustained move above $0.02729 could signal a potential pivot toward resistance at $0.03365, but if $0.02640 fails as support, the risk of a further downswing increases amid persistent negative sentiment.
Last time, analysts noted that The Graph (GRT) is trading below all major moving averages, with weak momentum indicators such as MACD, RSI, and CCI reflecting persistent bearish pressure despite a modest intraday gain. The asset is consolidating sideways with muted breakout potential, as technical resistance near $0.03373 caps upside while oversold momentum suggests any rebound is likely to be temporary.


-
 Afghanistan
-
 Albania
-
 Algeria
-
 Angola
-
 Argentina
-
 Armenia
-
 Australia
-
 Austria
-
 Azerbaijan
-
 Bahamas
-
 Bahrain
-
 Bangladesh
-
 Belarus
-
 Belgium
-
 Bolivia
-
 Botswana
-
 Brazil
-
 Brunei
-
 Bulgaria
-
 Cambodia
-
 Cameroon
-
 Canada
-
 Chile
Chile
-
 China
China
-
 Colombia
-
 Congo
Congo
-
 Costa Rica
-
 Cote d'Ivoire
-
 Croatia
-
 Cuba
Cuba
-
 Cyprus
-
 Czechia
-
 DR Congo
-
 Denmark
-
 Dominican Republic
-
 Ecuador
-
 Egypt
Egypt
-
 El Salvador
-
 Estonia
-
 Eswatini
-
 Ethiopia
-
 Finland
-
 France
-
 Georgia
-
 Germany
-
 Ghana
Ghana
-
 Greece
-
 Haiti
Haiti
-
 Hong Kong
-
 Hungary
-
 India
India
-
 Indonesia
-
 Iran, Islamic republic
-
 Iraq
Iraq
-
 Ireland
-
 Israel
-
 Italy
Italy
-
 Jamaica
-
 Japan
Japan
-
 Jordan
-
 Kazakhstan
-
 Kenya
Kenya
-
 Korea
Korea
-
 Kuwait
-
 Kyrgyzstan
-
 Laos
Laos
-
 Latvia
-
 Lebanon
-
 Lesotho
-
 Libya
Libya
-
 Lithuania
-
 Luxembourg
-
 Madagascar
-
 Malaysia
-
 Malta
Malta
-
 Mauritius
-
 Mexico
-
 Moldova
-
 Mongolia
-
 Montenegro
-
 Morocco
-
 Mozambique
-
 Myanmar
-
 Namibia
-
 Nepal
Nepal
-
 Netherlands
-
 New Zealand
-
 Nigeria
-
 North Macedonia
-
 Norway
-
 Oman
Oman
-
 Pakistan
-
 Palestine
-
 Panama
-
 Papua New Guinea
-
 Paraguay
-
 Peru
Peru
-
 Philippines
-
 Poland
-
 Portugal
-
 Puerto Rico
-
 Qatar
Qatar
-
 Reunion
-
 Romania
-
 Rwanda
-
 Saudi Arabia
-
 Serbia
-
 Singapore
-
 Slovakia
-
 Slovenia
-
 Somalia
-
 South Africa
-
 Spain
Spain
-
 Sri Lanka
-
 Sweden
-
 Switzerland
-
 Syria
Syria
-
 Taiwan
-
 Tajikistan
-
 Tanzania
-
 Thailand
-
 Trinidad and Tobago
-
 Tunisia
-
 Turkey
-
 UAE
UAE
-
 Uganda
-
 Ukraine
-
 United Kingdom
-
United States
-
 Uruguay
-
 Uzbekistan
-
 Venezuela
-
 Vietnam
-
 Yemen
Yemen
-
 Zambia
-
 Zimbabwe
- Forex
- Crypto
