
Bearish technicals and oversold readings — The Graph gains 7.66%

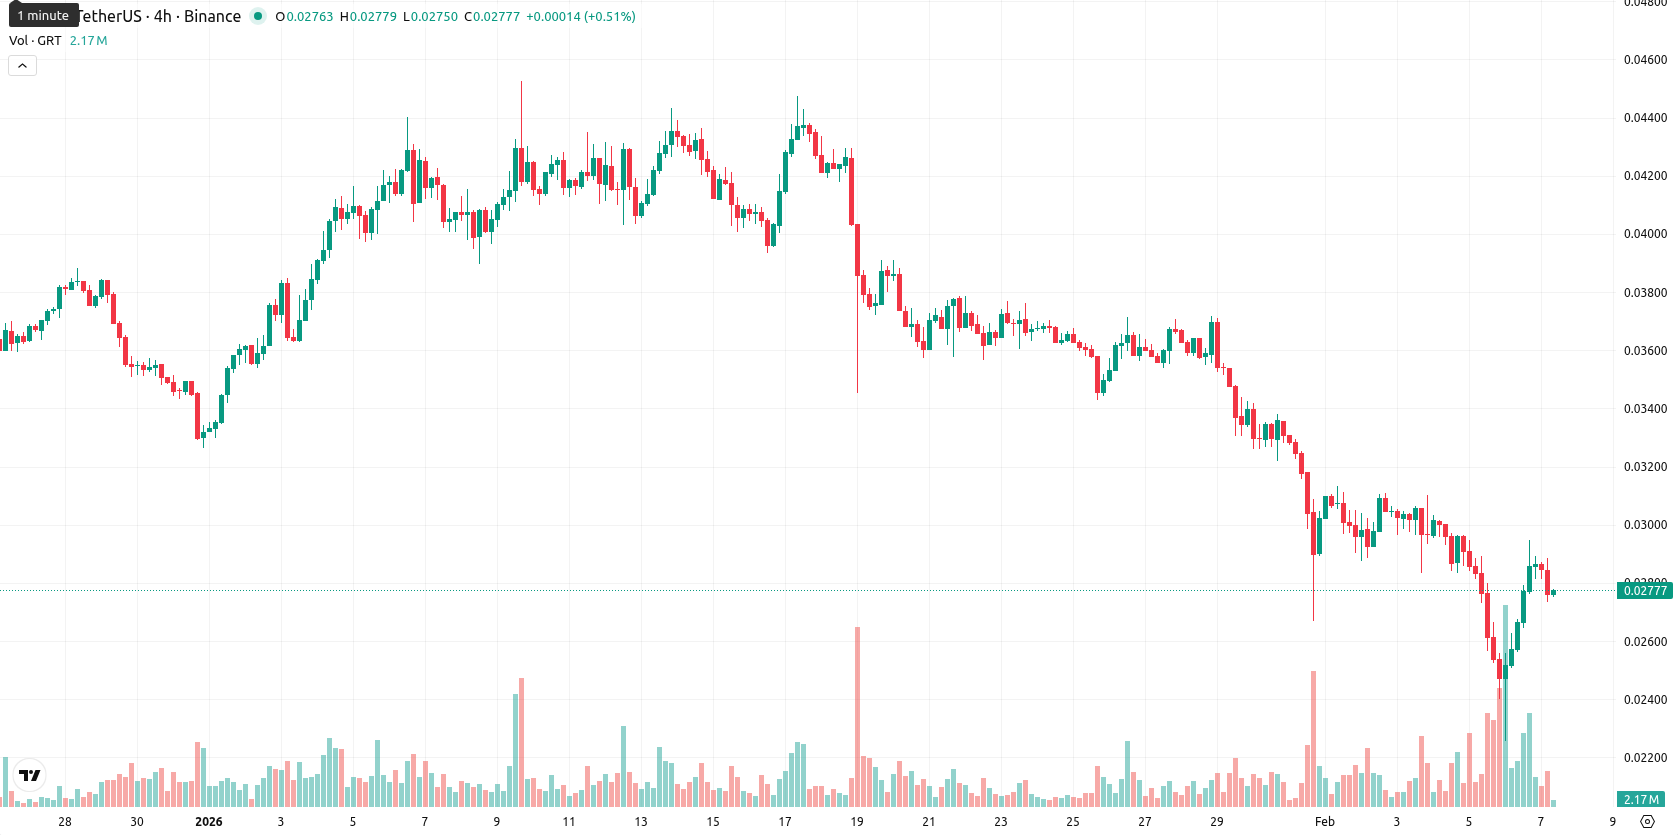
The Graph (GRT) is trading at $0.02768, up 7.66% on the day, having opened with a moderate gap above the previous close and now settling near the middle of today’s trading range. GRT remains below the MA-20 ($0.03379), MA-50 ($0.03691), and MA-200 ($0.06571), clearly reflecting ongoing selling pressure across short-, medium-, and long-term trends.
Highlights
- GRT trades at $0.02768, remaining below its MA-20 ($0.03379), MA-50 ($0.03691), and MA-200 ($0.06571), indicating ongoing multi-term selling pressure.
- Key support and resistance converge near the Ichimoku Kijun at $0.03373, with the daily price action constrained by moderate volatility amid a recent 7.66% uptick.
- Momentum signals (MACD, ADX, RSI at 36.8, CCI oversold) confirm a bearish outlook; primary scenario is sideways between $0.026–$0.029, with downside risk if $0.026 breaks.
Muted bullish signals offset by persistent bearish momentum
Technically, GRT faces dynamic support and resistance around the Ichimoku Kijun at $0.03373, with no golden or death cross present. Bearish daily momentum is reflected by weak MACD and ADX readings, a subdued RSI at 36.8, and CCI oversold conditions. The Stochastic RSI signals a strong buy, indicating short-term rebound potential, yet negative Bull/Bear Power underscores dominant selling pressure.
Sideways bias prevails amid weak breakout potential
Over the next five trading days, GRT is likely to fluctuate within a typical volatility band between $0.026 and $0.029. There is less than a 20% likelihood of a sustained upward move, as persistent technical weakness continues to weigh on price action. Sideways consolidation is the most probable scenario unless a decisive breakout above $0.03373 materializes — a move that currently appears unlikely. Should price break below the $0.026 level, additional declines toward recent lows would become increasingly probable.
Previously it was reported that The Graph (GRT) remains under bearish pressure, trading below its 20, 50, and 200-day moving averages despite a sharp intraday rebound. Key momentum indicators including MACD, ADX, and RSI signal persistent selling and deep oversold conditions, suggesting that while short-term buying may trigger a brief relief rally, the broader trend points to continued downside or consolidation.


-
 Afghanistan
-
 Albania
-
 Algeria
-
 Angola
-
 Argentina
-
 Armenia
-
 Australia
-
 Austria
-
 Azerbaijan
-
 Bahamas
-
 Bahrain
-
 Bangladesh
-
 Belarus
-
 Belgium
-
 Bolivia
-
 Botswana
-
 Brazil
-
 Brunei
-
 Bulgaria
-
 Cambodia
-
 Cameroon
-
 Canada
-
 Chile
Chile
-
 China
China
-
 Colombia
-
 Congo
Congo
-
 Costa Rica
-
 Cote d'Ivoire
-
 Croatia
-
 Cuba
Cuba
-
 Cyprus
-
 Czechia
-
 DR Congo
-
 Denmark
-
 Dominican Republic
-
 Ecuador
-
 Egypt
Egypt
-
 El Salvador
-
 Estonia
-
 Eswatini
-
 Ethiopia
-
 Finland
-
 France
-
 Georgia
-
 Germany
-
 Ghana
Ghana
-
 Greece
-
 Haiti
Haiti
-
 Hong Kong
-
 Hungary
-
 India
India
-
 Indonesia
-
 Iran, Islamic republic
-
 Iraq
Iraq
-
 Ireland
-
 Israel
-
 Italy
Italy
-
 Jamaica
-
 Japan
Japan
-
 Jordan
-
 Kazakhstan
-
 Kenya
Kenya
-
 Korea
Korea
-
 Kuwait
-
 Kyrgyzstan
-
 Laos
Laos
-
 Latvia
-
 Lebanon
-
 Lesotho
-
 Libya
Libya
-
 Lithuania
-
 Luxembourg
-
 Madagascar
-
 Malaysia
-
 Malta
Malta
-
 Mauritius
-
 Mexico
-
 Moldova
-
 Mongolia
-
 Montenegro
-
 Morocco
-
 Mozambique
-
 Myanmar
-
 Namibia
-
 Nepal
Nepal
-
 Netherlands
-
 New Zealand
-
 Nigeria
-
 North Macedonia
-
 Norway
-
 Oman
Oman
-
 Pakistan
-
 Palestine
-
 Panama
-
 Papua New Guinea
-
 Paraguay
-
 Peru
Peru
-
 Philippines
-
 Poland
-
 Portugal
-
 Puerto Rico
-
 Qatar
Qatar
-
 Reunion
-
 Romania
-
 Rwanda
-
 Saudi Arabia
-
 Serbia
-
 Singapore
-
 Slovakia
-
 Slovenia
-
 Somalia
-
 South Africa
-
 Spain
Spain
-
 Sri Lanka
-
 Sweden
-
 Switzerland
-
 Syria
Syria
-
 Taiwan
-
 Tajikistan
-
 Tanzania
-
 Thailand
-
 Trinidad and Tobago
-
 Tunisia
-
 Turkey
-
 UAE
UAE
-
 Uganda
-
 Ukraine
-
 United Kingdom
-
United States
-
 Uruguay
-
 Uzbekistan
-
 Venezuela
-
 Vietnam
-
 Yemen
Yemen
-
 Zambia
-
 Zimbabwe
- Forex
- Crypto
