
The Graph price prediction: Further upside unlikely? GRT gains 7.52% on intraday rally

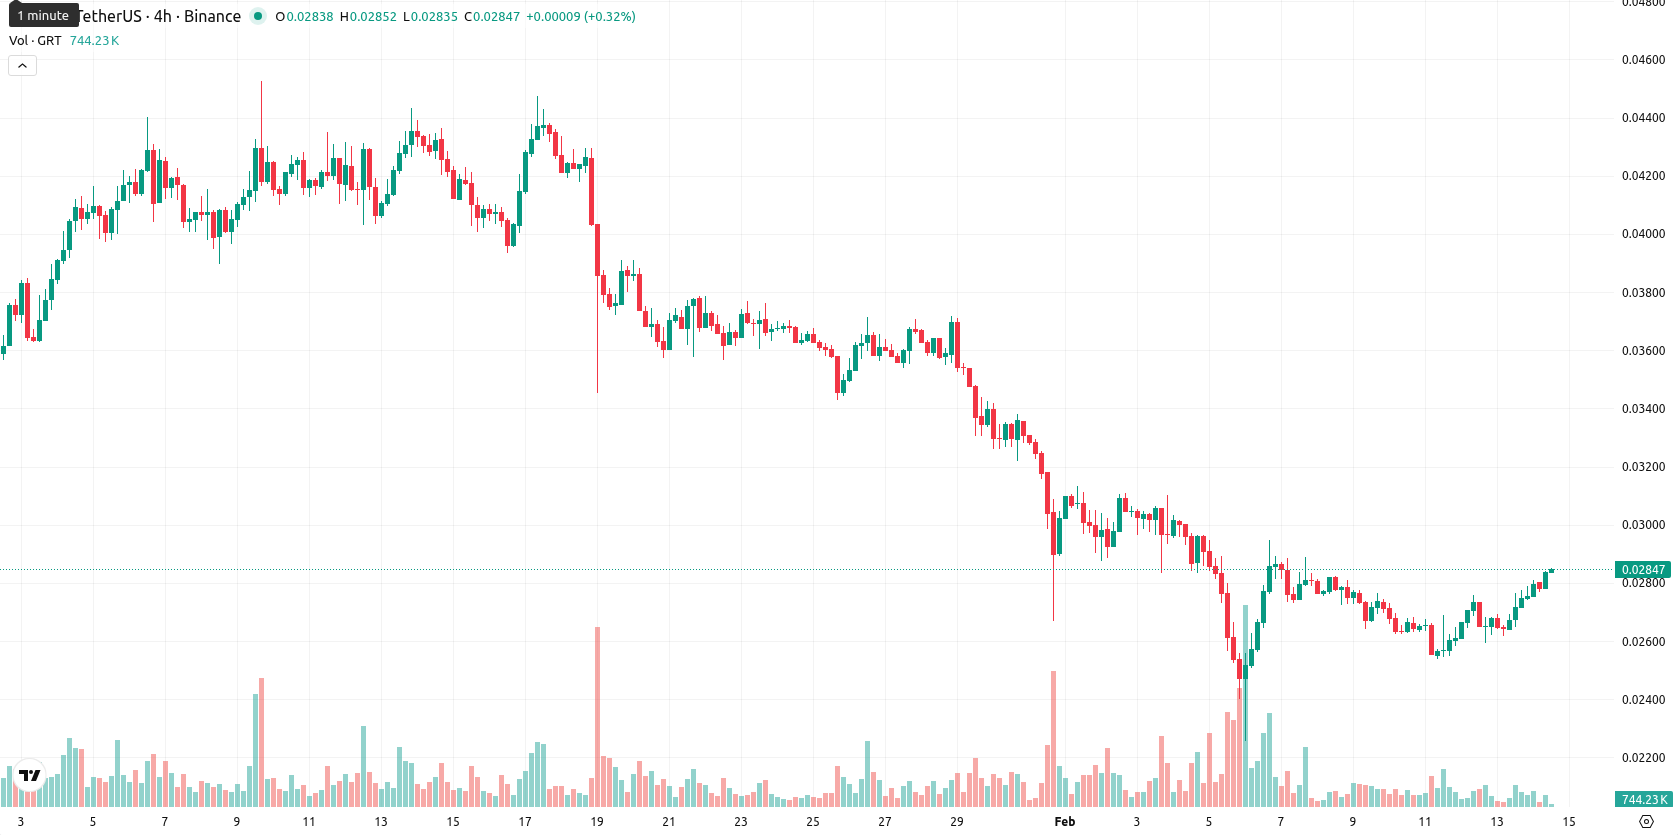
The Graph (GRT) is trading at $0.028547, which is below the 20-day ($0.030200), 50-day ($0.035534), and 200-day ($0.062946) Moving Averages, indicating that sellers continue to dominate across the short, medium, and long-term trends.
Highlights
- GRT is trading at $0.028547, below its 20-day ($0.030200), 50-day ($0.035534), and 200-day ($0.062946) Moving Averages, indicating sustained selling pressure across all timeframes.
- Daily MACD and ADX signal persistent bearish momentum, while the RSI is mildly oversold at 37.8 and the Stochastic RSI is overbought, showing a momentum-oscillator divergence.
- The expected 5-day price range is $0.0277–$0.0310, with the probability of a further price increase below 20% and baseline bias favoring a sideways to downward move.
Mixed momentum signals as bearish bias meets intraday gains
The nearest dynamic support is the Ichimoku Kijun level at $0.031450, with resistance likely at the 20-day Moving Average or above. Momentum signals are mixed: the daily MACD and ADX both signal persistent bearish momentum, while the Relative Strength Index is at 37.8 (mildly oversold) and the Stochastic RSI shows a pronounced overbought reading, highlighting a divergence between momentum and oscillator signals. Bull/Bear Power remains negative, reflecting persistent seller dominance in the intraday picture. The current price is trading near the upper end of today’s range, reflecting strong intraday gains of 7.52% with moderate volatility and pronounced upward pressure through the session.
Decline favored as rally odds remain subdued
For the next 5 trading days, the expected price range is $0.0277 to $0.0310. The probability of a further price increase is very low (less than 20%), making a decline the more likely scenario. The baseline scenario is a sideways movement within the corridor above $0.0277. A bullish scenario would require breaking above $0.0310, but the technical bias is not supportive. If bearish pressure intensifies and the price moves below $0.0277, lower levels may be tested.
Last time, analysts noted that The Graph is trading below all major moving averages, with persistent bearish momentum confirmed by technical indicators such as RSI, MACD, and ADX, alongside oversold conditions and continued dominance by sellers. The asset is expected to consolidate within a narrow range near current support and resistance levels, with elevated downside risk unless a decisive break above resistance occurs.


-
 Afghanistan
-
 Albania
-
 Algeria
-
 Angola
-
 Argentina
-
 Armenia
-
 Australia
-
 Austria
-
 Azerbaijan
-
 Bahamas
-
 Bahrain
-
 Bangladesh
-
 Belarus
-
 Belgium
-
 Bolivia
-
 Botswana
-
 Brazil
-
 Brunei
-
 Bulgaria
-
 Cambodia
-
 Cameroon
-
 Canada
-
 Chile
Chile
-
 China
China
-
 Colombia
-
 Congo
Congo
-
 Costa Rica
-
 Cote d'Ivoire
-
 Croatia
-
 Cuba
Cuba
-
 Cyprus
-
 Czechia
-
 DR Congo
-
 Denmark
-
 Dominican Republic
-
 Ecuador
-
 Egypt
Egypt
-
 El Salvador
-
 Estonia
-
 Eswatini
-
 Ethiopia
-
 Finland
-
 France
-
 Georgia
-
 Germany
-
 Ghana
Ghana
-
 Greece
-
 Haiti
Haiti
-
 Hong Kong
-
 Hungary
-
 India
India
-
 Indonesia
-
 Iran, Islamic republic
-
 Iraq
Iraq
-
 Ireland
-
 Israel
-
 Italy
Italy
-
 Jamaica
-
 Japan
Japan
-
 Jordan
-
 Kazakhstan
-
 Kenya
Kenya
-
 Korea
Korea
-
 Kuwait
-
 Kyrgyzstan
-
 Laos
Laos
-
 Latvia
-
 Lebanon
-
 Lesotho
-
 Libya
Libya
-
 Lithuania
-
 Luxembourg
-
 Madagascar
-
 Malaysia
-
 Malta
Malta
-
 Mauritius
-
 Mexico
-
 Moldova
-
 Mongolia
-
 Montenegro
-
 Morocco
-
 Mozambique
-
 Myanmar
-
 Namibia
-
 Nepal
Nepal
-
 Netherlands
-
 New Zealand
-
 Nigeria
-
 North Macedonia
-
 Norway
-
 Oman
Oman
-
 Pakistan
-
 Palestine
-
 Panama
-
 Papua New Guinea
-
 Paraguay
-
 Peru
Peru
-
 Philippines
-
 Poland
-
 Portugal
-
 Puerto Rico
-
 Qatar
Qatar
-
 Reunion
-
 Romania
-
 Rwanda
-
 Saudi Arabia
-
 Serbia
-
 Singapore
-
 Slovakia
-
 Slovenia
-
 Somalia
-
 South Africa
-
 Spain
Spain
-
 Sri Lanka
-
 Sweden
-
 Switzerland
-
 Syria
Syria
-
 Taiwan
-
 Tajikistan
-
 Tanzania
-
 Thailand
-
 Trinidad and Tobago
-
 Tunisia
-
 Turkey
-
 UAE
UAE
-
 Uganda
-
 Ukraine
-
 United Kingdom
-
United States
-
 Uruguay
-
 Uzbekistan
-
 Venezuela
-
 Vietnam
-
 Yemen
Yemen
-
 Zambia
-
 Zimbabwe
- Forex
- Crypto
