
The Graph price prediction: Further downside ahead? GRT drops 7.38%

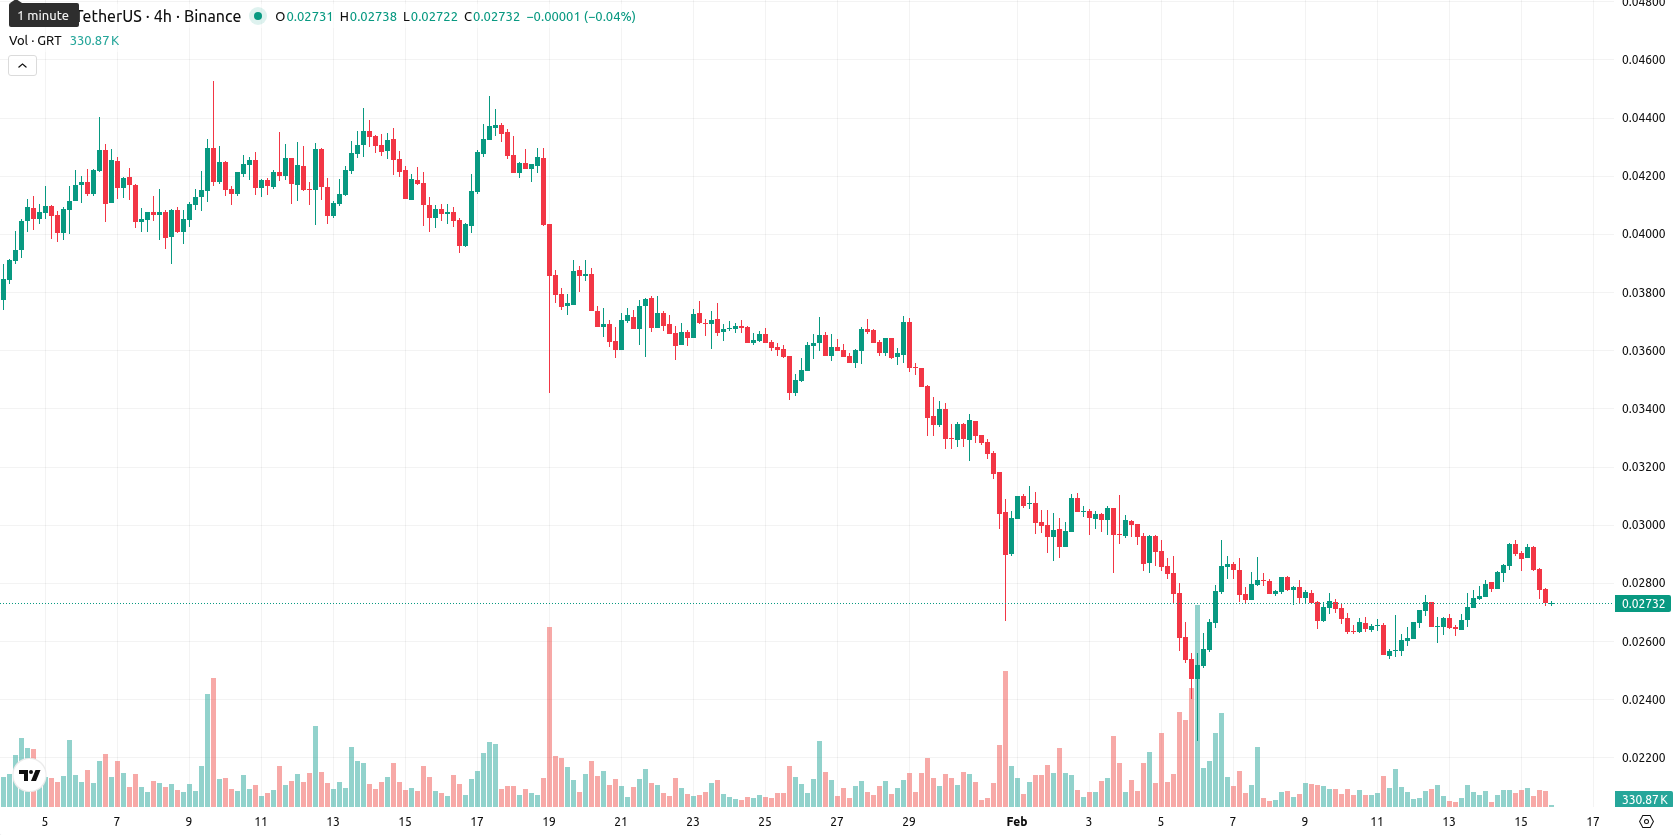
The Graph (GRT) is trading at $0.02725, down 7.38% for the session and sitting below the MA-20 ($0.029903), MA-50 ($0.035388), and MA-200 ($0.062580), reflecting sustained downward pressure over short-, medium-, and long-term timeframes.
Highlights
- GRT trades at $0.02725, below its MA-20 ($0.029903), MA-50 ($0.035388), and MA-200 ($0.062580), reflecting sustained bearish momentum across all timeframes.
- Intraday sentiment is weak, with a 7.38% price decline, high volatility, and dominant selling pressure keeping the price near session lows.
- Key levels are marked by resistance at $0.030835 (Ichimoku Kijun) and support at $0.02690, with a further downside likely if support breaks.
Bearish signals persist as resistance caps price and oscillators diverge
Technical analysis shows GRT faces resistance at the Ichimoku Kijun level of $0.030835 on the daily chart, with support likely in the immediate zone or recent intraday lows. All key moving averages remain above the current price, highlighting continued bearishness. Momentum signals are negative overall: MACD and ADX indicate further downside, daily RSI sits at 43 (weak but not oversold), while Stochastic RSI is overbought and CCI is neutral, reflecting mixed signals among oscillators. Bull/Bear Power shows a slight buyer edge intraday, though prevailing sentiment is weak and price action is dominated by selling during a volatile session.
Limited upside expected as downward momentum outweighs rebound risks
Over the next five trading days, GRT is likely to consolidate sideways within a typical volatility band of $0.02690 to $0.02760 as selling pressure is gradually absorbed. Based on bearish signals from weekly MACD, RSI, ADX, and moving averages, there is a greater probability of a continued decline, while the chance of a price rebound is under 20%. Should the price close above $0.030835 (Ichimoku Kijun), a corrective rally toward prior resistance may develop. A break below $0.02690 would confirm downside momentum and could trigger a fresh move lower.
Previously it was reported that The Graph remains under bearish pressure, trading below all key moving averages with mixed momentum signals as the MACD and ADX confirm prevailing negative sentiment, while oscillators highlight divergence. The asset faces resistance near the 20-day moving average and support at the Ichimoku Kijun level, with further downside favored as rally probabilities remain subdued.


-
 Afghanistan
-
 Albania
-
 Algeria
-
 Angola
-
 Argentina
-
 Armenia
-
 Australia
-
 Austria
-
 Azerbaijan
-
 Bahamas
-
 Bahrain
-
 Bangladesh
-
 Belarus
-
 Belgium
-
 Bolivia
-
 Botswana
-
 Brazil
-
 Brunei
-
 Bulgaria
-
 Cambodia
-
 Cameroon
-
 Canada
-
 Chile
Chile
-
 China
China
-
 Colombia
-
 Congo
Congo
-
 Costa Rica
-
 Cote d'Ivoire
-
 Croatia
-
 Cuba
Cuba
-
 Cyprus
-
 Czechia
-
 DR Congo
-
 Denmark
-
 Dominican Republic
-
 Ecuador
-
 Egypt
Egypt
-
 El Salvador
-
 Estonia
-
 Eswatini
-
 Ethiopia
-
 Finland
-
 France
-
 Georgia
-
 Germany
-
 Ghana
Ghana
-
 Greece
-
 Haiti
Haiti
-
 Hong Kong
-
 Hungary
-
 India
India
-
 Indonesia
-
 Iran, Islamic republic
-
 Iraq
Iraq
-
 Ireland
-
 Israel
-
 Italy
Italy
-
 Jamaica
-
 Japan
Japan
-
 Jordan
-
 Kazakhstan
-
 Kenya
Kenya
-
 Korea
Korea
-
 Kuwait
-
 Kyrgyzstan
-
 Laos
Laos
-
 Latvia
-
 Lebanon
-
 Lesotho
-
 Libya
Libya
-
 Lithuania
-
 Luxembourg
-
 Madagascar
-
 Malaysia
-
 Malta
Malta
-
 Mauritius
-
 Mexico
-
 Moldova
-
 Mongolia
-
 Montenegro
-
 Morocco
-
 Mozambique
-
 Myanmar
-
 Namibia
-
 Nepal
Nepal
-
 Netherlands
-
 New Zealand
-
 Nigeria
-
 North Macedonia
-
 Norway
-
 Oman
Oman
-
 Pakistan
-
 Palestine
-
 Panama
-
 Papua New Guinea
-
 Paraguay
-
 Peru
Peru
-
 Philippines
-
 Poland
-
 Portugal
-
 Puerto Rico
-
 Qatar
Qatar
-
 Reunion
-
 Romania
-
 Rwanda
-
 Saudi Arabia
-
 Serbia
-
 Singapore
-
 Slovakia
-
 Slovenia
-
 Somalia
-
 South Africa
-
 Spain
Spain
-
 Sri Lanka
-
 Sweden
-
 Switzerland
-
 Syria
Syria
-
 Taiwan
-
 Tajikistan
-
 Tanzania
-
 Thailand
-
 Trinidad and Tobago
-
 Tunisia
-
 Turkey
-
 UAE
UAE
-
 Uganda
-
 Ukraine
-
 United Kingdom
-
United States
-
 Uruguay
-
 Uzbekistan
-
 Venezuela
-
 Vietnam
-
 Yemen
Yemen
-
 Zambia
-
 Zimbabwe
- Forex
- Crypto
