
GRT trades sideways with support at $0.0270 and trend indicators favoring further weakness – weekly report

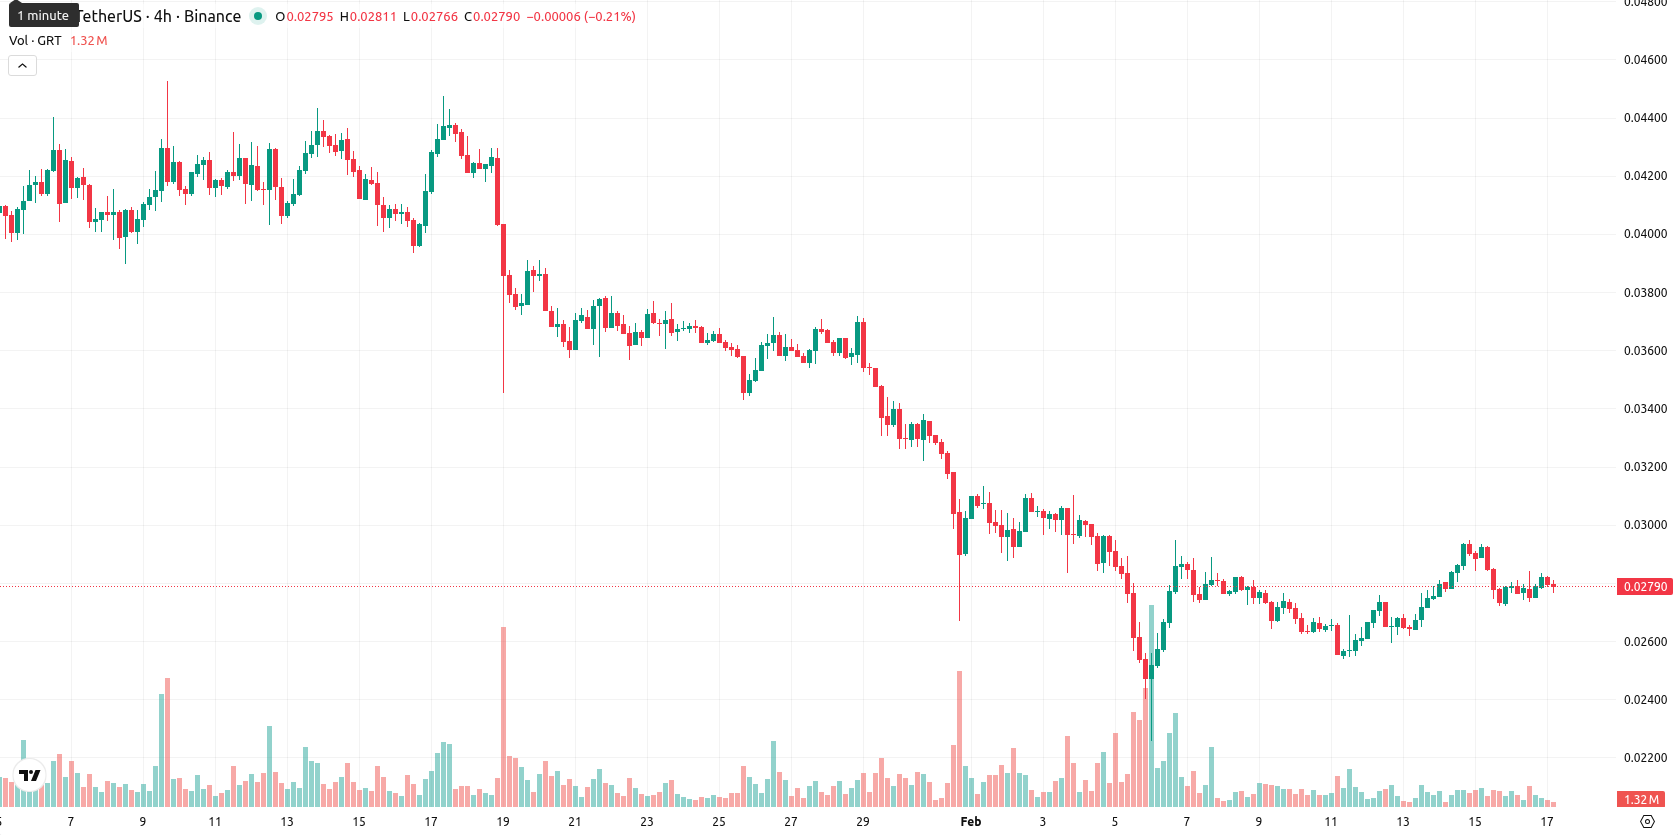
The Graph (GRT) finished the week at $0.02788, posting a decline both in absolute terms and as a percentage against the prior week's levels. GRT remains below the weekly MA-20 ($0.029069), MA-50 ($0.034989), and MA-200 ($0.061889), underscoring persistent selling pressure and confirming a clear downtrend across all major weekly moving averages.
Highlights
- GRT is trading at $0.02788, below MA-20 ($0.029069), MA-50 ($0.034989), and MA-200 ($0.061889), indicating sustained multi-timeframe selling pressure.
- Momentum indicators—including MACD, ADX, and RSI—signal a strong bearish bias, with less than a 20% probability of price increase over the next week.
- Key levels for the coming days are support near $0.0270 and resistance at $0.0302; a move below support likely extends the downtrend.
Bearish momentum prevails as major averages and signals reinforce trend
On the weekly timeframe, GRT trades consistently under major moving averages. The Ichimoku Kijun at $0.030215 serves as dynamic resistance, with MA-20 providing additional resistance nearby, while $0.0270 offers notable support. Weekly MACD and ADX both signal a strong bearish setup, reinforcing trend weakness, and the RSI (W1) hovers in neutral to slightly bearish territory, reflecting ongoing selling momentum.
Sideways-to-lower range expected as technicals favor further weakness
Looking ahead, the technical outlook for the next week points toward continued sideways to downward movement, with GRT likely to fluctuate between $0.02510 and $0.03010. The probability of an upward reversal is low, with W1 momentum signals and trend indicators favoring the bears. A break below $0.0270 could accelerate declines toward the lower end of the projected range, while a decisive close above $0.0302 would be required for the first sign of a bullish breakout.
Last time, analysts noted that The Graph continues to exhibit sustained bearish momentum, trading below all major moving averages with negative signals from MACD and ADX, while daily RSI remains weak but not oversold. Resistance is established near the Ichimoku Kijun level, with limited upside expected and a higher probability of further downside unless support at intraday lows breaks or a clear move above resistance occurs.


-
 Afghanistan
-
 Albania
-
 Algeria
-
 Angola
-
 Argentina
-
 Armenia
-
 Australia
-
 Austria
-
 Azerbaijan
-
 Bahamas
-
 Bahrain
-
 Bangladesh
-
 Belarus
-
 Belgium
-
 Bolivia
-
 Botswana
-
 Brazil
-
 Brunei
-
 Bulgaria
-
 Cambodia
-
 Cameroon
-
 Canada
-
 Chile
Chile
-
 China
China
-
 Colombia
-
 Congo
Congo
-
 Costa Rica
-
 Cote d'Ivoire
-
 Croatia
-
 Cuba
Cuba
-
 Cyprus
-
 Czechia
-
 DR Congo
-
 Denmark
-
 Dominican Republic
-
 Ecuador
-
 Egypt
Egypt
-
 El Salvador
-
 Estonia
-
 Eswatini
-
 Ethiopia
-
 Finland
-
 France
-
 Georgia
-
 Germany
-
 Ghana
Ghana
-
 Greece
-
 Haiti
Haiti
-
 Hong Kong
-
 Hungary
-
 India
India
-
 Indonesia
-
 Iran, Islamic republic
-
 Iraq
Iraq
-
 Ireland
-
 Israel
-
 Italy
Italy
-
 Jamaica
-
 Japan
Japan
-
 Jordan
-
 Kazakhstan
-
 Kenya
Kenya
-
 Korea
Korea
-
 Kuwait
-
 Kyrgyzstan
-
 Laos
Laos
-
 Latvia
-
 Lebanon
-
 Lesotho
-
 Libya
Libya
-
 Lithuania
-
 Luxembourg
-
 Madagascar
-
 Malaysia
-
 Malta
Malta
-
 Mauritius
-
 Mexico
-
 Moldova
-
 Mongolia
-
 Montenegro
-
 Morocco
-
 Mozambique
-
 Myanmar
-
 Namibia
-
 Nepal
Nepal
-
 Netherlands
-
 New Zealand
-
 Nigeria
-
 North Macedonia
-
 Norway
-
 Oman
Oman
-
 Pakistan
-
 Palestine
-
 Panama
-
 Papua New Guinea
-
 Paraguay
-
 Peru
Peru
-
 Philippines
-
 Poland
-
 Portugal
-
 Puerto Rico
-
 Qatar
Qatar
-
 Reunion
-
 Romania
-
 Rwanda
-
 Saudi Arabia
-
 Serbia
-
 Singapore
-
 Slovakia
-
 Slovenia
-
 Somalia
-
 South Africa
-
 Spain
Spain
-
 Sri Lanka
-
 Sweden
-
 Switzerland
-
 Syria
Syria
-
 Taiwan
-
 Tajikistan
-
 Tanzania
-
 Thailand
-
 Trinidad and Tobago
-
 Tunisia
-
 Turkey
-
 UAE
UAE
-
 Uganda
-
 Ukraine
-
 United Kingdom
-
United States
-
 Uruguay
-
 Uzbekistan
-
 Venezuela
-
 Vietnam
-
 Yemen
Yemen
-
 Zambia
-
 Zimbabwe
- Forex
- Crypto
