
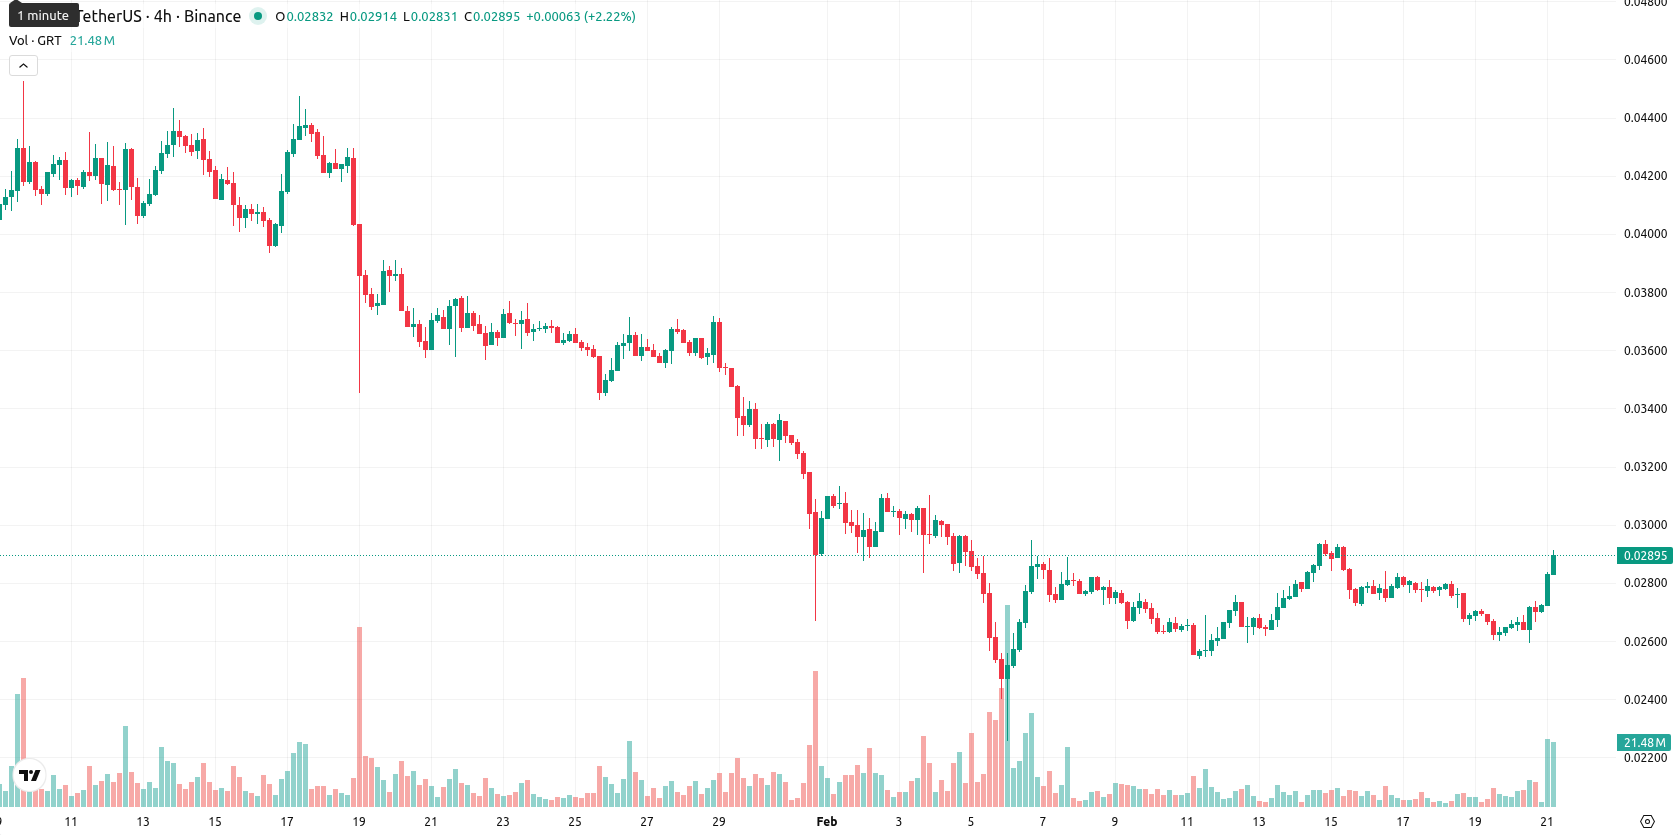
The Graph rises 9.16% as short-term buyers challenge medium-term resistance

The Graph (GRT) is trading at $0.029058, slightly above the MA-20 ($0.027783) but below the MA-50 ($0.034368) and MA-200 ($0.060612), indicating short-term strength yet a prevailing medium- and long-term bearish bias. The Ichimoku Kijun level sits at $0.02987, which currently acts as immediate resistance.
Highlights
- GRT is trading at $0.029058, slightly above the MA-20 ($0.027783) but below the MA-50 ($0.034368) and MA-200 ($0.060612), indicating short-term strength amid a broader bearish trend.
- Intraday signals show strong buyer interest, with price rallying close to the high and momentum oscillators mixed, yet daily and weekly MACD and ADX remain bearish.
- Key technical levels are immediate resistance at $0.02987 and support at $0.026, with expected consolidation in the $0.026–$0.031 range and less than 20% probability of a sustained price increase.
Mixed momentum as intraday bullishness meets persistent bearish trend
Momentum signals present a mixed picture: the daily MACD and ADX remain bearish, but the intraday Bull/Bear Power and RSI reflect growing buyer dominance, with the Awesome Oscillator neutral on the daily frame. The Stochastic RSI is overbought, while CCI is neutral and RSI remains weak, suggesting lingering downside pressure despite today's positive move. The price opened higher than the previous close (no gap), rallied close to the intraday high, and shows high volatility with strong buying evident after the open. However, the persistence of bearish signals on higher timeframes creates a divergence with the bullish intraday tone.
Downside risk prevails unless resistance breakout occurs
For the coming week, the expected range should be adjusted to $0.026 – $0.031 to reflect typical volatility around the current price. There is a very low probability (less than 20%) of a sustained price increase, while a further decline remains more likely given strong sell signals from the weekly Moving Averages, RSI, ADX, and MACD. The baseline scenario sees GRT consolidating within the $0.026 – $0.031 volatility band relative to current levels. A bullish scenario would require a breakout above the $0.02987 resistance, while a bearish outcome could see a drop toward the $0.026 level if support fails.
Last time, analysts noted that The Graph ended the week below all major weekly moving averages, with persistent bearish momentum underscored by negative MACD and ADX readings and a neutral-to-bearish RSI. Technicals indicate continued downside bias, with resistance near the Ichimoku Kijun and MA-20, support at $0.0270, and a low probability of upward reversal without a decisive move above $0.0302.


-
 Afghanistan
-
 Albania
-
 Algeria
-
 Angola
-
 Argentina
-
 Armenia
-
 Australia
-
 Austria
-
 Azerbaijan
-
 Bahamas
-
 Bahrain
-
 Bangladesh
-
 Belarus
-
 Belgium
-
 Bolivia
-
 Botswana
-
 Brazil
-
 Brunei
-
 Bulgaria
-
 Cambodia
-
 Cameroon
-
 Canada
-
 Chile
Chile
-
 China
China
-
 Colombia
-
 Congo
Congo
-
 Costa Rica
-
 Cote d'Ivoire
-
 Croatia
-
 Cuba
Cuba
-
 Cyprus
-
 Czechia
-
 DR Congo
-
 Denmark
-
 Dominican Republic
-
 Ecuador
-
 Egypt
Egypt
-
 El Salvador
-
 Estonia
-
 Eswatini
-
 Ethiopia
-
 Finland
-
 France
-
 Georgia
-
 Germany
-
 Ghana
Ghana
-
 Greece
-
 Haiti
Haiti
-
 Hong Kong
-
 Hungary
-
 India
India
-
 Indonesia
-
 Iran, Islamic republic
-
 Iraq
Iraq
-
 Ireland
-
 Israel
-
 Italy
Italy
-
 Jamaica
-
 Japan
Japan
-
 Jordan
-
 Kazakhstan
-
 Kenya
Kenya
-
 Korea
Korea
-
 Kuwait
-
 Kyrgyzstan
-
 Laos
Laos
-
 Latvia
-
 Lebanon
-
 Lesotho
-
 Libya
Libya
-
 Lithuania
-
 Luxembourg
-
 Madagascar
-
 Malaysia
-
 Malta
Malta
-
 Mauritius
-
 Mexico
-
 Moldova
-
 Mongolia
-
 Montenegro
-
 Morocco
-
 Mozambique
-
 Myanmar
-
 Namibia
-
 Nepal
Nepal
-
 Netherlands
-
 New Zealand
-
 Nigeria
-
 North Macedonia
-
 Norway
-
 Oman
Oman
-
 Pakistan
-
 Palestine
-
 Panama
-
 Papua New Guinea
-
 Paraguay
-
 Peru
Peru
-
 Philippines
-
 Poland
-
 Portugal
-
 Puerto Rico
-
 Qatar
Qatar
-
 Reunion
-
 Romania
-
 Rwanda
-
 Saudi Arabia
-
 Serbia
-
 Singapore
-
 Slovakia
-
 Slovenia
-
 Somalia
-
 South Africa
-
 Spain
Spain
-
 Sri Lanka
-
 Sweden
-
 Switzerland
-
 Syria
Syria
-
 Taiwan
-
 Tajikistan
-
 Tanzania
-
 Thailand
-
 Trinidad and Tobago
-
 Tunisia
-
 Turkey
-
 UAE
UAE
-
 Uganda
-
 Ukraine
-
 United Kingdom
-
United States
-
 Uruguay
-
 Uzbekistan
-
 Venezuela
-
 Vietnam
-
 Yemen
Yemen
-
 Zambia
-
 Zimbabwe
- Forex
- Crypto
