
NEAR jumps 7.23% as price breaks above MA-20 but meets resistance from Kijun

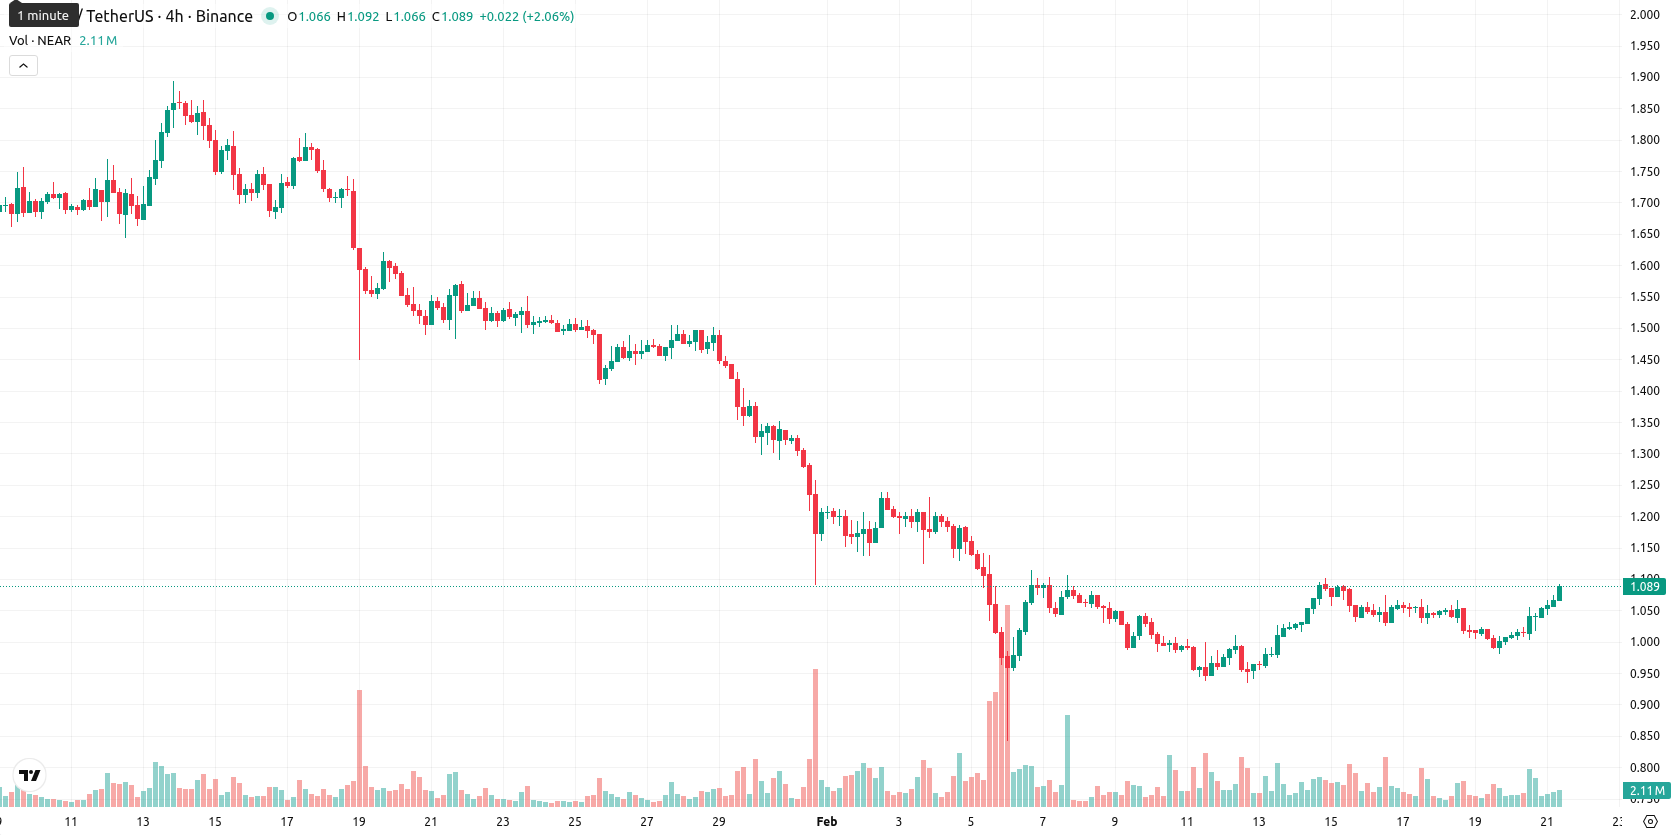
NEAR (NEAR) is trading at $1.0862 after a 7.23% daily gain, positioning itself above the MA-20 ($1.0588) while remaining well below both the MA-50 ($1.3900) and MA-200 ($2.0803). This dynamic signals short-term bullish momentum within otherwise persistent medium- and long-term downtrends.
Highlights
- NEAR trades at $1.0862, above its MA-20 ($1.0588) but remains notably below the MA-50 ($1.3900) and MA-200 ($2.0803), underscoring persistent medium- and long-term downtrends.
- Momentum indicators are mixed: MACD and ADX indicate ongoing bearish pressure while the RSI (39.17) and Bull/Bear Power remain in 'Sell' territory, but Stochastic RSI flags overbought conditions.
- For the next five trading days, NEAR is expected to range between $1.00 and $1.15, with less than a 20% probability of further upside and heightened risk of a pullback.
Mixed momentum as resistance levels and volatility amplify caution
On the technical side, NEAR’s price is capped by immediate resistance from the Ichimoku Kijun at $1.1730, with the MA-20 offering short-term support and heavier resistance looming at the MA-50 and MA-200. Daily momentum gauges are mixed — the MACD and ADX reflect ongoing bearish pressure, the RSI at 39.17 and Bull/Bear Power sit firmly in “Sell” territory, while a deeply overbought Stochastic RSI calls for caution and hints at a potential pause or pullback; the Amazing Oscillator shows neutral daily performance but points to recent strength on intraday moves, with heightened volatility keeping NEAR near its session highs.
Range-bound outlook as sustained downtrends cap breakout odds
Looking ahead over the next five trading days, NEAR is expected to remain within a typical volatility band between $1.00 and $1.15, with upside beyond this range having a low probability (less than 20%). The baseline assumption is for range-bound action just below immediate resistance, as the medium- and long-term downtrends persist. If buyers break above $1.17, momentum could accelerate toward $1.15, but a loss of traction would likely see prices reverse below $1.00.
Last time, analysts noted that NEAR is exhibiting persistent bearish momentum, trading below all major moving averages with technical indicators highlighting negative weekly momentum and mixed oscillator signals. Immediate support is seen around $1.04 as the asset consolidates, with limited rebound potential and the probability of further downside if support fails.


-
 Afghanistan
-
 Albania
-
 Algeria
-
 Angola
-
 Argentina
-
 Armenia
-
 Australia
-
 Austria
-
 Azerbaijan
-
 Bahamas
-
 Bahrain
-
 Bangladesh
-
 Belarus
-
 Belgium
-
 Bolivia
-
 Botswana
-
 Brazil
-
 Brunei
-
 Bulgaria
-
 Cambodia
-
 Cameroon
-
 Canada
-
 Chile
Chile
-
 China
China
-
 Colombia
-
 Congo
Congo
-
 Costa Rica
-
 Cote d'Ivoire
-
 Croatia
-
 Cuba
Cuba
-
 Cyprus
-
 Czechia
-
 DR Congo
-
 Denmark
-
 Dominican Republic
-
 Ecuador
-
 Egypt
Egypt
-
 El Salvador
-
 Estonia
-
 Eswatini
-
 Ethiopia
-
 Finland
-
 France
-
 Georgia
-
 Germany
-
 Ghana
Ghana
-
 Greece
-
 Haiti
Haiti
-
 Hong Kong
-
 Hungary
-
 India
India
-
 Indonesia
-
 Iran, Islamic republic
-
 Iraq
Iraq
-
 Ireland
-
 Israel
-
 Italy
Italy
-
 Jamaica
-
 Japan
Japan
-
 Jordan
-
 Kazakhstan
-
 Kenya
Kenya
-
 Korea
Korea
-
 Kuwait
-
 Kyrgyzstan
-
 Laos
Laos
-
 Latvia
-
 Lebanon
-
 Lesotho
-
 Libya
Libya
-
 Lithuania
-
 Luxembourg
-
 Madagascar
-
 Malaysia
-
 Malta
Malta
-
 Mauritius
-
 Mexico
-
 Moldova
-
 Mongolia
-
 Montenegro
-
 Morocco
-
 Mozambique
-
 Myanmar
-
 Namibia
-
 Nepal
Nepal
-
 Netherlands
-
 New Zealand
-
 Nigeria
-
 North Macedonia
-
 Norway
-
 Oman
Oman
-
 Pakistan
-
 Palestine
-
 Panama
-
 Papua New Guinea
-
 Paraguay
-
 Peru
Peru
-
 Philippines
-
 Poland
-
 Portugal
-
 Puerto Rico
-
 Qatar
Qatar
-
 Reunion
-
 Romania
-
 Rwanda
-
 Saudi Arabia
-
 Serbia
-
 Singapore
-
 Slovakia
-
 Slovenia
-
 Somalia
-
 South Africa
-
 Spain
Spain
-
 Sri Lanka
-
 Sweden
-
 Switzerland
-
 Syria
Syria
-
 Taiwan
-
 Tajikistan
-
 Tanzania
-
 Thailand
-
 Trinidad and Tobago
-
 Tunisia
-
 Turkey
-
 UAE
UAE
-
 Uganda
-
 Ukraine
-
 United Kingdom
-
United States
-
 Uruguay
-
 Uzbekistan
-
 Venezuela
-
 Vietnam
-
 Yemen
Yemen
-
 Zambia
-
 Zimbabwe
- Forex
- Crypto
