
Celestia retreats as price sticks below long-term average

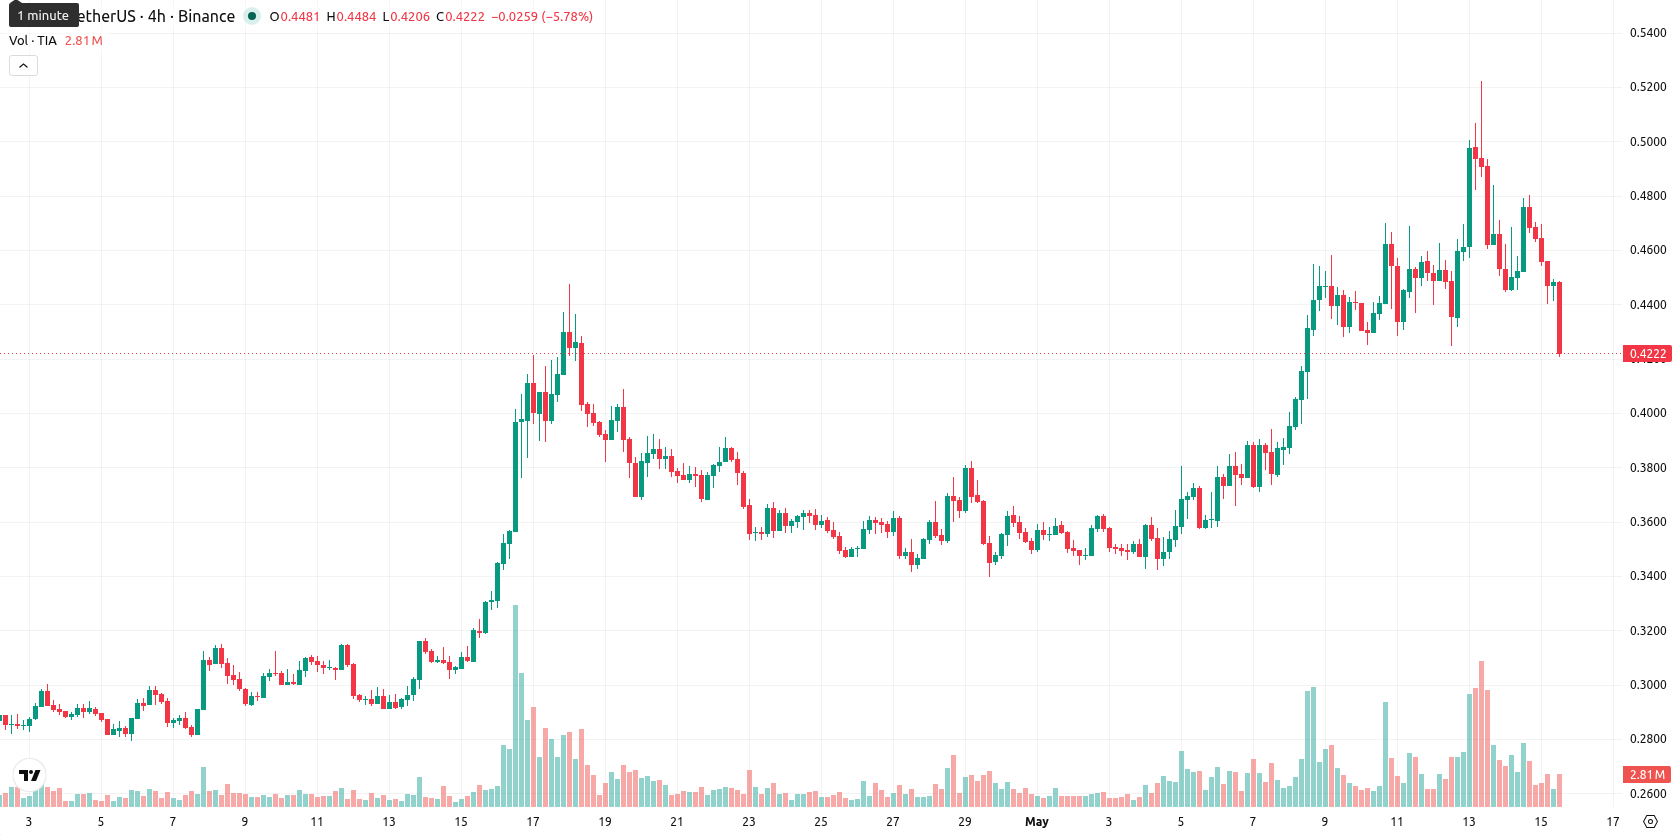
Celestia (TIA) is trading at $0.4282 after a daily decline of 7.36%. The price sits above its key short- and medium-term moving averages but remains below the longer-term trend level.
Highlights
- Celestia’s data availability platform was recognized as critical for Web3 infrastructure, supporting rollup interoperability and innovative fee mechanisms.
- Despite increased visibility and high trading volumes, the asset faces continued technical vulnerability, prompting heightened near-term selling and volatility.
- TIA displays short-term bullish momentum but overbought signals and bearish price action suggest consolidation between $0.3900 and $0.4700, with downside risk prevailing.
Volatility heightens as adoption optimism fails to offset persistent weakness
On May 14, 2026, Celestia’s modular data availability solution was identified as an important component among Web3 data networks, with particular emphasis on its fee mechanisms and its role in supporting rollup interoperability. This recognition may foster future adoption and developer engagement, but has not mitigated ongoing technical weakness. Elevated trading volumes were also recorded, contributing to pronounced volatility and reinforcing near-term selling activity.
Buy signals face overbought pressures with resistance nearing
On the technical front, TIA is positioned above the SMA-20 at $0.3924 and the SMA-50 at $0.3519, while remaining below the long-term SMA-200 at $0.4814. Immediate resistance is identified at the Ichimoku Kijun level of $0.4310, just above the current price. Momentum indicators on the daily chart remain strong, with both MACD and ADX signaling 'Buy.' However, oscillator readings show significant overbought conditions, as RSI stands at 72.65, CCI at 115.27, and Stoch RSI at 96.09, all indicating upside exhaustion. Bull/Bear Power reflects positive buyer dominance intraday, but the Awesome Oscillator remains neutral, providing no additional directional guidance.
Downside risks persist as weak momentum limits rebound potential
Over the coming week, TIA is expected to move within a $0.3900 to $0.4700 volatility band relative to current levels. The probability of a significant upward move is low, with less than a 20% chance of a price increase, while the risk of further declines is elevated in light of bearish weekly indicators. The likely scenario is a period of consolidation between $0.3900 and $0.4700. Should resistance at $0.4310 be breached, a test of the $0.4700 level may follow, while a breakdown below $0.3900 could result in a steeper decline.
Earlier, analysts noted that while Celestia demonstrated bullish momentum, ongoing volatility and mixed signals left its outlook uncertain. The latest developments underscore persistent technical fragility despite positive ecosystem recognition, making a decisive move above immediate resistance a key inflection point for traders monitoring further direction.


Latest Celestia News


-
 Afghanistan
-
 Albania
-
 Algeria
-
 Angola
-
 Argentina
-
 Armenia
-
 Australia
-
 Austria
-
 Azerbaijan
-
 Bahamas
-
 Bahrain
-
 Bangladesh
-
 Belarus
-
 Belgium
-
 Bolivia
-
 Botswana
-
 Brazil
-
 Brunei
-
 Bulgaria
-
 Cambodia
-
 Cameroon
-
 Canada
-
 Chile
Chile
-
 China
China
-
 Colombia
-
 Congo
Congo
-
 Costa Rica
-
 Cote d'Ivoire
-
 Croatia
-
 Cuba
Cuba
-
 Cyprus
-
 Czechia
-
 DR Congo
-
 Denmark
-
 Dominican Republic
-
 Ecuador
-
 Egypt
Egypt
-
 El Salvador
-
 Estonia
-
 Eswatini
-
 Ethiopia
-
 Finland
-
 France
-
 Georgia
-
 Germany
-
 Ghana
Ghana
-
 Greece
-
 Haiti
Haiti
-
 Hong Kong
-
 Hungary
-
 India
India
-
 Indonesia
-
 Iran, Islamic republic
-
 Iraq
Iraq
-
 Ireland
-
 Israel
-
 Italy
Italy
-
 Jamaica
-
 Japan
Japan
-
 Jordan
-
 Kazakhstan
-
 Kenya
Kenya
-
 Korea
Korea
-
 Kuwait
-
 Kyrgyzstan
-
 Laos
Laos
-
 Latvia
-
 Lebanon
-
 Lesotho
-
 Libya
Libya
-
 Lithuania
-
 Luxembourg
-
 Madagascar
-
 Malaysia
-
 Malta
Malta
-
 Mauritius
-
 Mexico
-
 Moldova
-
 Mongolia
-
 Montenegro
-
 Morocco
-
 Mozambique
-
 Myanmar
-
 Namibia
-
 Nepal
Nepal
-
 Netherlands
-
 New Zealand
-
 Nigeria
-
 North Macedonia
-
 Norway
-
 Oman
Oman
-
 Pakistan
-
 Palestine
-
 Panama
-
 Papua New Guinea
-
 Paraguay
-
 Peru
Peru
-
 Philippines
-
 Poland
-
 Portugal
-
 Puerto Rico
-
 Qatar
Qatar
-
 Reunion
-
 Romania
-
 Rwanda
-
 Saudi Arabia
-
 Serbia
-
 Singapore
-
 Slovakia
-
 Slovenia
-
 Somalia
-
 South Africa
-
 Spain
Spain
-
 Sri Lanka
-
 Sweden
-
 Switzerland
-
 Syria
Syria
-
 Taiwan
-
 Tajikistan
-
 Tanzania
-
 Thailand
-
 Trinidad and Tobago
-
 Tunisia
-
 Turkey
-
 UAE
UAE
-
 Uganda
-
 Ukraine
-
 United Kingdom
-
United States
-
 Uruguay
-
 Uzbekistan
-
 Venezuela
-
 Vietnam
-
 Yemen
Yemen
-
 Zambia
-
 Zimbabwe
- Forex
- Crypto
