
Costco stock: bearish momentum and overbought readings signal potential further downside

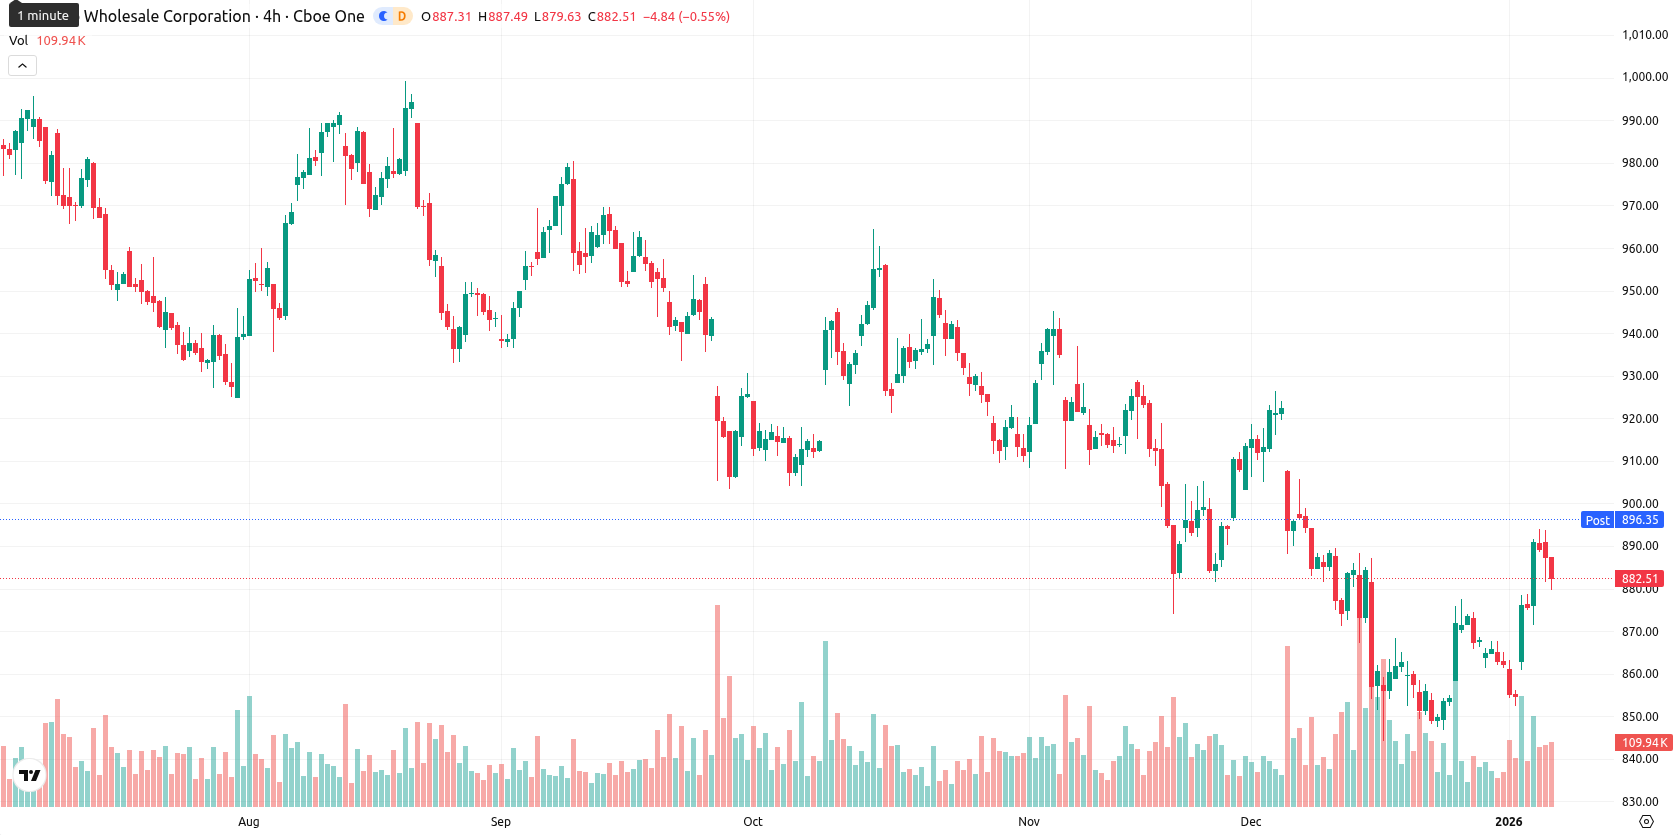
Costco Wholesale Corporation (COST) shares are currently trading at $882.66, sitting above the MA-20 ($869.09) but below the MA-50 ($895.84) and well under the MA-200 ($950.45). This suggests short-term bullish momentum, while medium- and long-term trends continue to face pressure from sellers, with the nearest dynamic support around the $869 – $885 zone, marked by the MA-20 and the Ichimoku Kijun at $885.19.
Highlights
- Costco reported December 2025 net sales of $29.86 billion, marking an 8.5% year-over-year increase driven by strong holiday performance.
- Total comparable sales rose 7% while digitally enabled sales surged 18.9%, highlighting robust e-commerce and in-store demand.
- Recurring quarterly dividend of $1.29 per share and membership renewal rates above 90% reinforce Costco's financial stability and reliable revenue base.
Renewed sales strength and high retention as digital and executive memberships rise
Costco reported an 8.5% year-over-year increase in December 2025 net sales to $29.86 billion, with total comparable sales up 7% and digitally enabled sales climbing 18.9%. The company's recurring quarterly dividend payment of $1.29 per share underscores its continued financial stability and commitment to shareholder returns. Costco maintains robust membership renewals above 90% and ongoing growth in Executive memberships, supporting steady revenue streams.
Bearish momentum and overbought signals as intraday sellers drive weakness
Momentum signals are mixed: the MACD shows strong bearish momentum on the daily timeframe, while the ADX value near 20 reflects a weak and indecisive trend. Oscillators indicate overbought conditions with the Stochastic RSI at 100 and the CCI above 100, yet the RSI remains moderate around 55. The Bull/Bear Power indicator points to recent overbought conditions but signals that sellers have started to dominate intraday, which matches today's price slide of 0.75%. The session opened slightly above the previous close (no significant gap), and the price now trades near the lower end of today’s range, reflecting moderate volatility and persistent pressure following the open. Despite some underlying strength in certain short-term indicators, the combination of overbought oscillators and bearish momentum underscores notable divergence in signals.
Downside risk rises as consolidation expected within volatile trading range
For the next five trading days, the expected price range is $860 to $900, normalized to reflect typical volatility for Costco’s stock around the current price. The probability of a price increase is very low (less than 20%), making a further drop more likely in the short term. In the baseline scenario, the share price is expected to consolidate between support at $869 and resistance at $895. A bullish scenario would require a sustained break above the $895 – $900 area, while a bearish move below $869 could target lower levels near $860.
Previously it was reported that Costco shares are trading below key moving averages, with mixed momentum readings—bearish MACD, weak ADX trend, and an RSI in the low-to-mid range—signaling short- to long-term downside pressure amid modest consolidation. Resistance remains firm near the Ichimoku Kijun at $885, support is weak, and the immediate outlook favors sideways movement with a slight bias toward further weakness unless a decisive breakout occurs.


-
 Afghanistan
-
 Albania
-
 Algeria
-
 Angola
-
 Argentina
-
 Armenia
-
 Australia
-
 Austria
-
 Azerbaijan
-
 Bahamas
-
 Bahrain
-
 Bangladesh
-
 Belarus
-
 Belgium
-
 Bolivia
-
 Botswana
-
 Brazil
-
 Brunei
-
 Bulgaria
-
 Cambodia
-
 Cameroon
-
 Canada
-
 Chile
Chile
-
 China
China
-
 Colombia
-
 Congo
Congo
-
 Costa Rica
-
 Cote d'Ivoire
-
 Croatia
-
 Cuba
Cuba
-
 Cyprus
-
 Czechia
-
 DR Congo
-
 Denmark
-
 Dominican Republic
-
 Ecuador
-
 Egypt
Egypt
-
 El Salvador
-
 Estonia
-
 Eswatini
-
 Ethiopia
-
 Finland
-
 France
-
 Georgia
-
 Germany
-
 Ghana
Ghana
-
 Greece
-
 Haiti
Haiti
-
 Hong Kong
-
 Hungary
-
 India
India
-
 Indonesia
-
 Iran, Islamic republic
-
 Iraq
Iraq
-
 Ireland
-
 Israel
-
 Italy
Italy
-
 Jamaica
-
 Japan
Japan
-
 Jordan
-
 Kazakhstan
-
 Kenya
Kenya
-
 Korea
Korea
-
 Kuwait
-
 Kyrgyzstan
-
 Laos
Laos
-
 Latvia
-
 Lebanon
-
 Lesotho
-
 Libya
Libya
-
 Lithuania
-
 Luxembourg
-
 Madagascar
-
 Malaysia
-
 Malta
Malta
-
 Mauritius
-
 Mexico
-
 Moldova
-
 Mongolia
-
 Montenegro
-
 Morocco
-
 Mozambique
-
 Myanmar
-
 Namibia
-
 Nepal
Nepal
-
 Netherlands
-
 New Zealand
-
 Nigeria
-
 North Macedonia
-
 Norway
-
 Oman
Oman
-
 Pakistan
-
 Palestine
-
 Panama
-
 Papua New Guinea
-
 Paraguay
-
 Peru
Peru
-
 Philippines
-
 Poland
-
 Portugal
-
 Puerto Rico
-
 Qatar
Qatar
-
 Reunion
-
 Romania
-
 Rwanda
-
 Saudi Arabia
-
 Serbia
-
 Singapore
-
 Slovakia
-
 Slovenia
-
 Somalia
-
 South Africa
-
 Spain
Spain
-
 Sri Lanka
-
 Sweden
-
 Switzerland
-
 Syria
Syria
-
 Taiwan
-
 Tajikistan
-
 Tanzania
-
 Thailand
-
 Trinidad and Tobago
-
 Tunisia
-
 Turkey
-
 UAE
UAE
-
 Uganda
-
 Ukraine
-
 United Kingdom
-
United States
-
 Uruguay
-
 Uzbekistan
-
 Venezuela
-
 Vietnam
-
 Yemen
Yemen
-
 Zambia
-
 Zimbabwe
- Forex
- Crypto
