
Persistent selling pressure sends Solana down

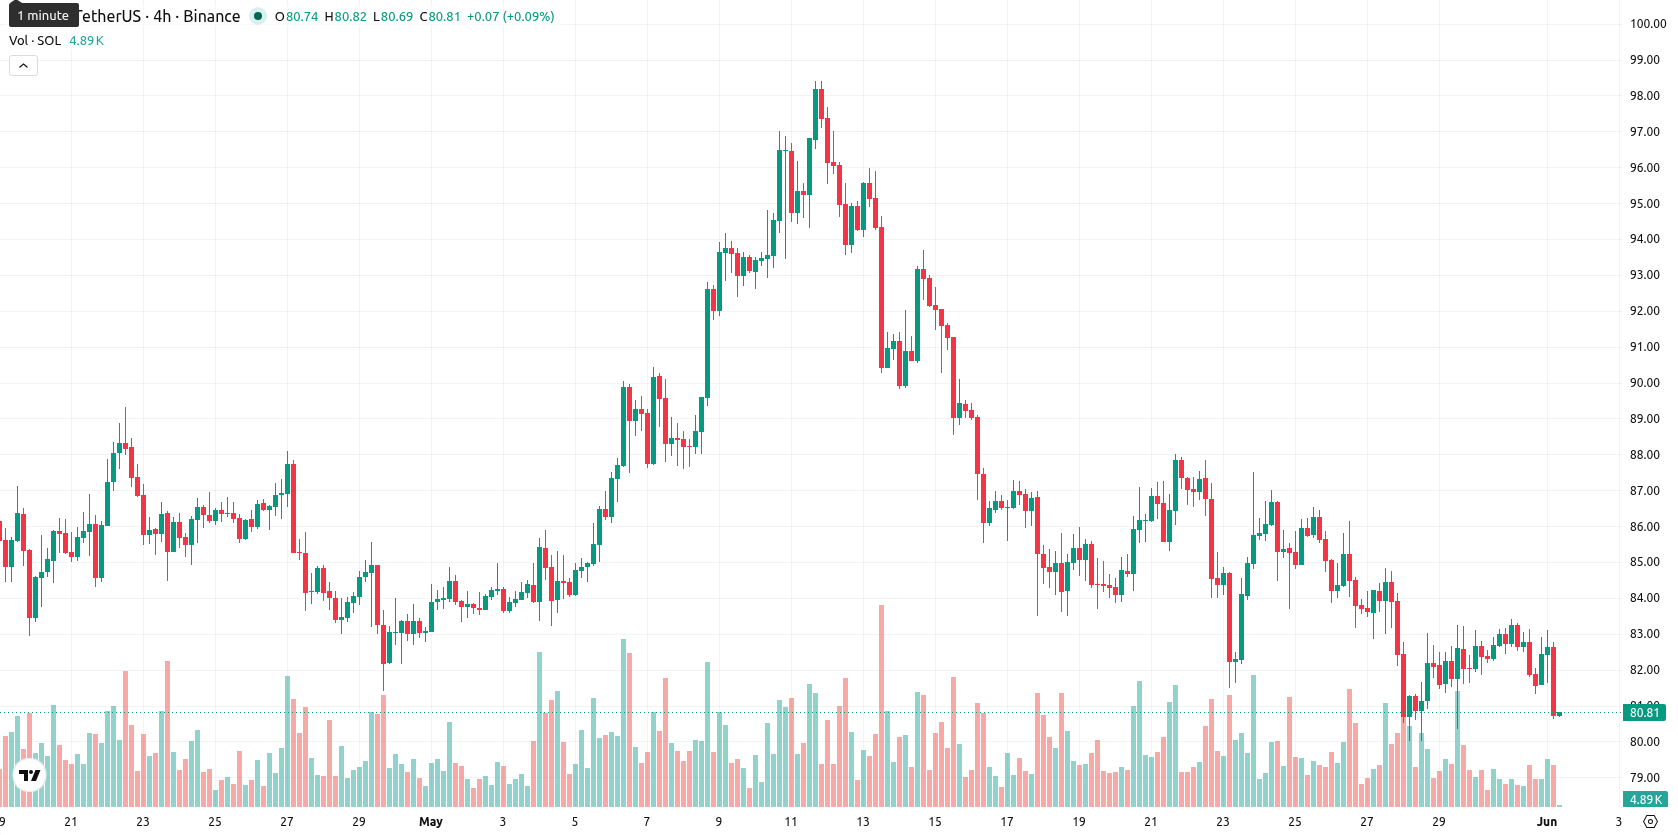
Solana (SOL) is trading at $80.88, declining 2.12% on the session. The asset remains below its key moving averages, marking continued downside momentum across all timeframes.
Highlights
- Solana activated a resource-based burn mechanism via SIMD-547, immediately increasing its daily token burn rate and impacting SOL supply dynamics.
- The Alpenglow consensus upgrade launched on a community validator cluster for testing, signaling upcoming protocol changes despite continued selling pressure.
- SOL trades below key moving averages, with persistent bearish momentum and an expected trading range of $77.00 to $85.00 over the next five days.
Token economics shift as burn mechanism and network upgrade take effect
Solana entered a live network governance phase as co-founder Anatoly Yakovenko supported the implementation of the SIMD-547 proposal, which introduces a resource-based burn mechanism on computationally expensive transactions and raises the daily token burn rate. This move immediately alters the circulating supply of SOL, shifting the network's underlying economic model. In parallel, the Alpenglow consensus upgrade was launched for testing on a community validator cluster on May 11, deploying new protocol mechanics ahead of potential mainnet adoption, though price action has remained under broader selling pressure.
Oversold signals and negative momentum as resistance holds
On the technical chart, SOL remains under all major moving averages: SMA-20 is at $85.89, SMA-50 at $86.39, and SMA-200 at $104.48. Key resistance is set by the Ichimoku Kijun on the daily chart at $89.21. Downward momentum is reflected by negative MACD readings on daily and weekly timeframes, while ADX is neutral on D1 but signals a strengthening trend on W1. RSI sits at 40.31 (D1) and 37.24 (W1), suggesting subdued momentum, with Stoch RSI and CCI both indicating oversold conditions. BBP is deeply negative, confirming intraday seller dominance, and the Awesome Oscillator remains negative as well. Price action has remained volatile, covering the lower end of the intraday range ($81.18–$83.03), with no conflicting signals across oscillators and momentum indicators.
Downside risk dominates as volatility bands cap breakout odds
In the next five trading days, SOL is expected to trade within a volatility band of $77.00 to $85.00, consistent with current intraday volatility and recent price action. The probability of a significant price increase remains low, with estimates below 20%, which puts further declines at higher likelihood. The base scenario calls for continued consolidation near current levels. Should a bullish reversal materialize with a close above $89.21, a short-term rally could emerge. Conversely, a breakdown and close below $77.00 would open additional downside risk for Solana.
Earlier, analysts noted that Solana was experiencing continued bearish momentum amid persistent seller dominance and technical weakness. The latest governance changes and protocol upgrades reinforce a cautious outlook, making the $77.00 level a critical threshold to monitor for potential downside acceleration in the immediate term.


Latest Solana News


-
 Afghanistan
-
 Albania
-
 Algeria
-
 Angola
-
 Argentina
-
 Armenia
-
 Australia
-
 Austria
-
 Azerbaijan
-
 Bahamas
-
 Bahrain
-
 Bangladesh
-
 Belarus
-
 Belgium
-
 Bolivia
-
 Botswana
-
 Brazil
-
 Brunei
-
 Bulgaria
-
 Cambodia
-
 Cameroon
-
 Canada
-
 Chile
Chile
-
 China
China
-
 Colombia
-
 Congo
Congo
-
 Costa Rica
-
 Cote d'Ivoire
-
 Croatia
-
 Cuba
Cuba
-
 Cyprus
-
 Czechia
-
 DR Congo
-
 Denmark
-
 Dominican Republic
-
 Ecuador
-
 Egypt
Egypt
-
 El Salvador
-
 Estonia
-
 Eswatini
-
 Ethiopia
-
 Finland
-
 France
-
 Georgia
-
 Germany
-
 Ghana
Ghana
-
 Greece
-
 Haiti
Haiti
-
 Hong Kong
-
 Hungary
-
 India
India
-
 Indonesia
-
 Iran, Islamic republic
-
 Iraq
Iraq
-
 Ireland
-
 Israel
-
 Italy
Italy
-
 Jamaica
-
 Japan
Japan
-
 Jordan
-
 Kazakhstan
-
 Kenya
Kenya
-
 Korea
Korea
-
 Kuwait
-
 Kyrgyzstan
-
 Laos
Laos
-
 Latvia
-
 Lebanon
-
 Lesotho
-
 Libya
Libya
-
 Lithuania
-
 Luxembourg
-
 Madagascar
-
 Malaysia
-
 Malta
Malta
-
 Mauritius
-
 Mexico
-
 Moldova
-
 Mongolia
-
 Montenegro
-
 Morocco
-
 Mozambique
-
 Myanmar
-
 Namibia
-
 Nepal
Nepal
-
 Netherlands
-
 New Zealand
-
 Nigeria
-
 North Macedonia
-
 Norway
-
 Oman
Oman
-
 Pakistan
-
 Palestine
-
 Panama
-
 Papua New Guinea
-
 Paraguay
-
 Peru
Peru
-
 Philippines
-
 Poland
-
 Portugal
-
 Puerto Rico
-
 Qatar
Qatar
-
 Reunion
-
 Romania
-
 Rwanda
-
 Saudi Arabia
-
 Serbia
-
 Singapore
-
 Slovakia
-
 Slovenia
-
 Somalia
-
 South Africa
-
 Spain
Spain
-
 Sri Lanka
-
 Sweden
-
 Switzerland
-
 Syria
Syria
-
 Taiwan
-
 Tajikistan
-
 Tanzania
-
 Thailand
-
 Trinidad and Tobago
-
 Tunisia
-
 Turkey
-
 UAE
UAE
-
 Uganda
-
 Ukraine
-
 United Kingdom
-
United States
-
 Uruguay
-
 Uzbekistan
-
 Venezuela
-
 Vietnam
-
 Yemen
Yemen
-
 Zambia
-
 Zimbabwe
- Forex
- Crypto
