
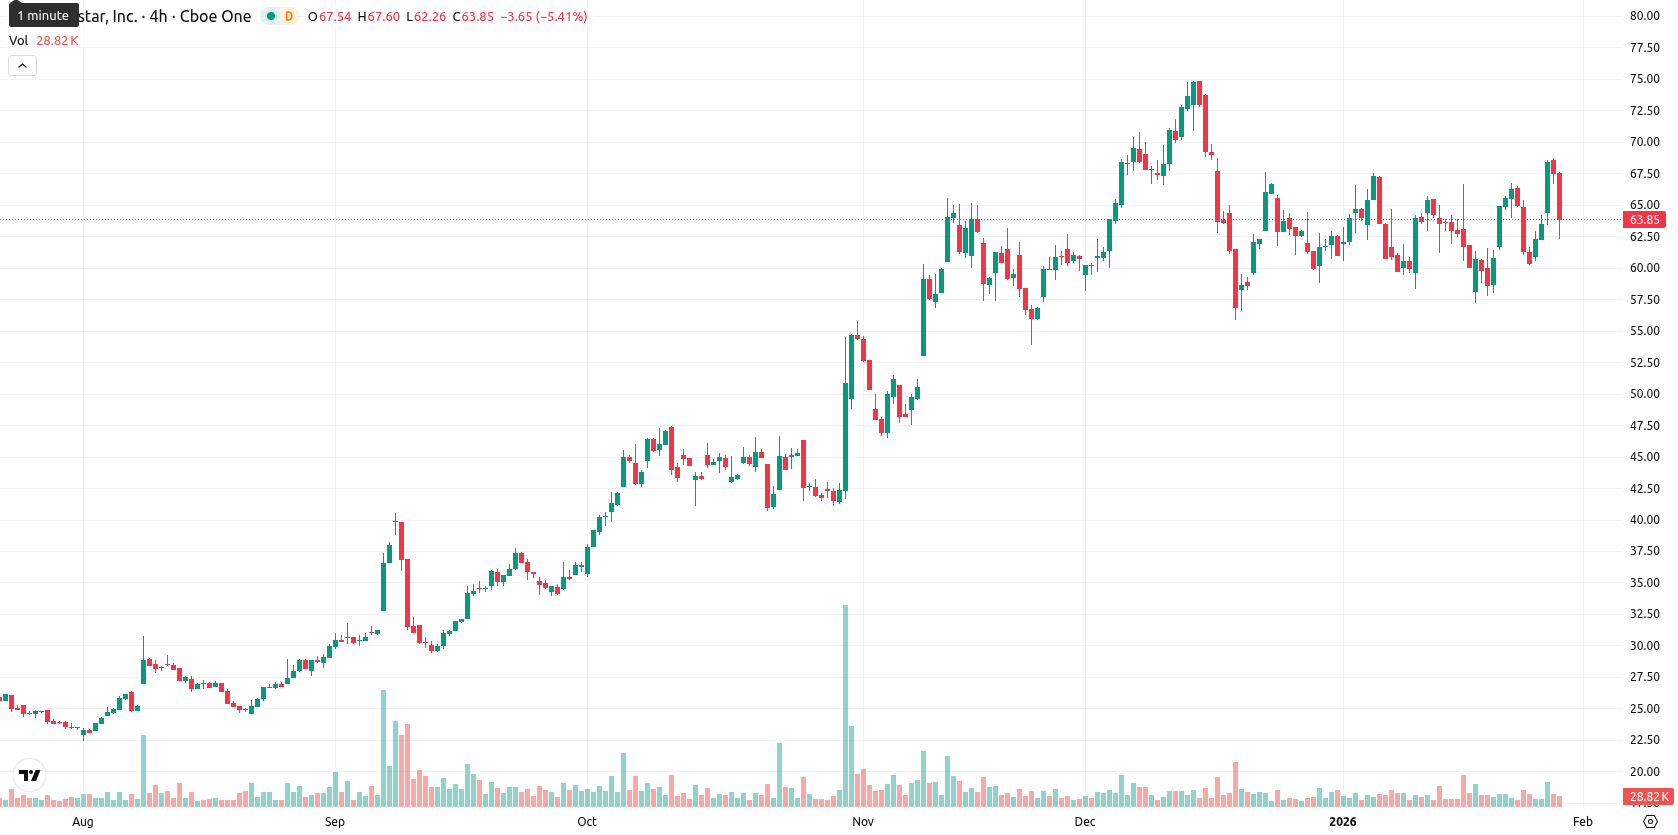
Globalstar stock slides 5.54% as short-term momentum diverges despite strong long-term support

Globalstar, Inc. (GSAT) is trading at $63.81, having dropped 5.54% from the prior close, and sits at the lower end of today’s range ($62.64 – $67.41). The price is positioned above the MA-20 at $62.80, slightly above the MA-50 at $63.15, and substantially above the MA-200 at $37.97, signaling short- and medium-term bullish momentum with strong long-term support.
Highlights
- The price at $63.81 is above MA-20 ($62.80), MA-50 ($63.15), and MA-200 ($37.97), confirming a short- and medium-term bullish structure.
- Daily momentum is mixed: MACD gives a buy signal, but ADX is neutral (18.29) and oscillators show overbought conditions, while intraday volatility remains high.
- Key support is at $62.97 (Ichimoku Kijun), resistance at $66.00, with a projected 5-day range of $61.50–$66.00 and a high probability of sideways consolidation.
Mixed momentum confirms overbought bias amid weak trend strength
Momentum readings are mixed, with the daily MACD signaling a buy, while the ADX at 18.29 remains neutral and indicates a lack of strong directional movement. Oscillators are diverging as the Stochastic RSI and Commodity Channel Index indicate overbought conditions, while the RSI is in buy territory but not extreme. Bull/Bear Power displays an overbought, positive value, reflecting recent buyer dominance, and the Awesome Oscillator is positive in alignment with prevailing trends. Immediate dynamic support is found at the Ichimoku Kijun ($62.97), with resistance near the MA-50 and today’s recent high, amid persistent intraday selling pressure.
Upward breakout likely as consolidation holds above volatile support
For the next five sessions, the typical volatility band is projected between $61.50 and $66.00, reflecting current price location and recent fluctuations. There is a very high probability (over 80%) of an upward price move, based on strong bullish signals from the weekly MACD, RSI, ADX, and moving averages. In the base scenario, GSAT should consolidate sideways above short-term support at $62.97 and below resistance at $66.00. Upside momentum may accelerate on a sustained break above $66.00, while a fall under $61.50 could signal a deeper pullback toward medium-term support.
Previously it was reported that Globalstar Inc. is sustaining a bullish structure, trading above its short-, medium-, and long-term moving averages with MACD signaling ongoing upward momentum while the ADX remains neutral. However, multiple oscillators indicate overbought conditions and today’s price action reflects heightened selling pressure and intraday volatility near session lows, suggesting possible short-term exhaustion despite the broader uptrend.


Latest Globalstar News


-
 Afghanistan
-
 Albania
-
 Algeria
-
 Angola
-
 Argentina
-
 Armenia
-
 Australia
-
 Austria
-
 Azerbaijan
-
 Bahamas
-
 Bahrain
-
 Bangladesh
-
 Belarus
-
 Belgium
-
 Bolivia
-
 Botswana
-
 Brazil
-
 Brunei
-
 Bulgaria
-
 Cambodia
-
 Cameroon
-
 Canada
-
 Chile
Chile
-
 China
China
-
 Colombia
-
 Congo
Congo
-
 Costa Rica
-
 Cote d'Ivoire
-
 Croatia
-
 Cuba
Cuba
-
 Cyprus
-
 Czechia
-
 DR Congo
-
 Denmark
-
 Dominican Republic
-
 Ecuador
-
 Egypt
Egypt
-
 El Salvador
-
 Estonia
-
 Eswatini
-
 Ethiopia
-
 Finland
-
 France
-
 Georgia
-
 Germany
-
 Ghana
Ghana
-
 Greece
-
 Haiti
Haiti
-
 Hong Kong
-
 Hungary
-
 India
India
-
 Indonesia
-
 Iran, Islamic republic
-
 Iraq
Iraq
-
 Ireland
-
 Israel
-
 Italy
Italy
-
 Jamaica
-
 Japan
Japan
-
 Jordan
-
 Kazakhstan
-
 Kenya
Kenya
-
 Korea
Korea
-
 Kuwait
-
 Kyrgyzstan
-
 Laos
Laos
-
 Latvia
-
 Lebanon
-
 Lesotho
-
 Libya
Libya
-
 Lithuania
-
 Luxembourg
-
 Madagascar
-
 Malaysia
-
 Malta
Malta
-
 Mauritius
-
 Mexico
-
 Moldova
-
 Mongolia
-
 Montenegro
-
 Morocco
-
 Mozambique
-
 Myanmar
-
 Namibia
-
 Nepal
Nepal
-
 Netherlands
-
 New Zealand
-
 Nigeria
-
 North Macedonia
-
 Norway
-
 Oman
Oman
-
 Pakistan
-
 Palestine
-
 Panama
-
 Papua New Guinea
-
 Paraguay
-
 Peru
Peru
-
 Philippines
-
 Poland
-
 Portugal
-
 Puerto Rico
-
 Qatar
Qatar
-
 Reunion
-
 Romania
-
 Rwanda
-
 Saudi Arabia
-
 Serbia
-
 Singapore
-
 Slovakia
-
 Slovenia
-
 Somalia
-
 South Africa
-
 Spain
Spain
-
 Sri Lanka
-
 Sweden
-
 Switzerland
-
 Syria
Syria
-
 Taiwan
-
 Tajikistan
-
 Tanzania
-
 Thailand
-
 Trinidad and Tobago
-
 Tunisia
-
 Turkey
-
 UAE
UAE
-
 Uganda
-
 Ukraine
-
 United Kingdom
-
United States
-
 Uruguay
-
 Uzbekistan
-
 Venezuela
-
 Vietnam
-
 Yemen
Yemen
-
 Zambia
-
 Zimbabwe
- Forex
- Crypto
