
AST SpaceMobile stock rises 4.25% as bullish momentum and strong revenue support price action

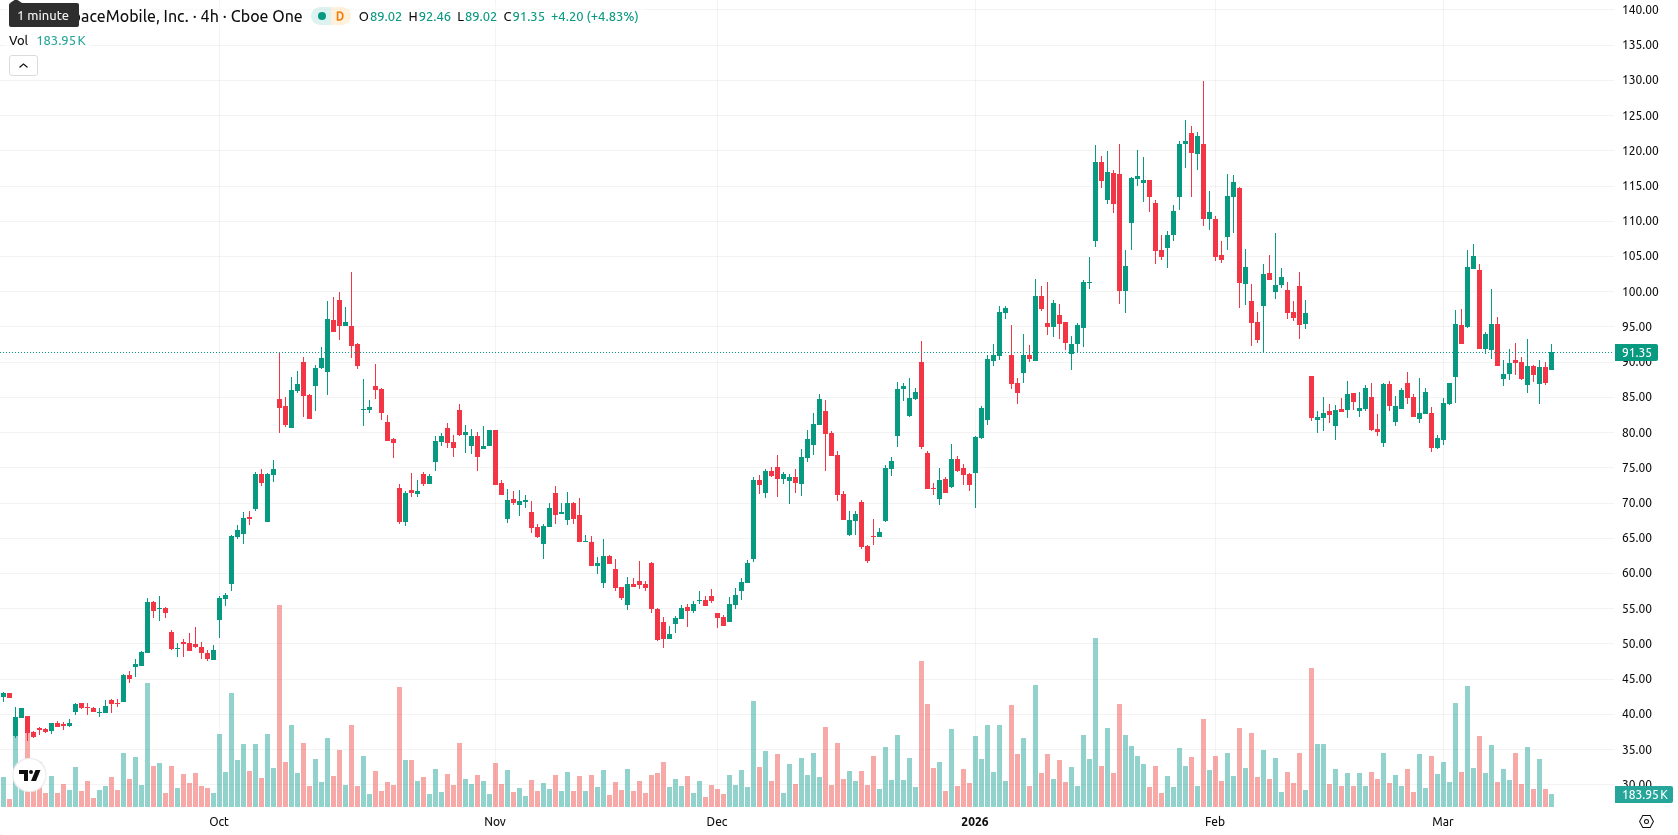
AST SpaceMobile (ASTS) is currently trading at $90.79, positioned above the SMA-20 ($86.81), below the SMA-50 ($95.27), and well above the SMA-200 ($65.80). This reflects short-term bullish momentum with medium-term resistance, and places the stock above key long-term support levels.
Highlights
- AST SpaceMobile generated $70.9 million revenue in 2025, driven by gateway hardware, government milestones, and consulting gains.
- Management targets full commercial service by 2027, with anticipated strong revenue growth pending market demand and customer expansion.
- Technicals indicate near-term bullish bias, with price expected to trade between $82.00 and $98.00, upward move favored over decline.
Revenue growth outlook improves as operations and backlog expand
AST SpaceMobile has transitioned into a revenue-generating phase, closing full-year 2025 with total revenue of $70.9 million, supported by strong fourth-quarter contributions from gateway hardware, government milestones, and mobile operator consulting. The company is expanding its operations alongside a growing backlog and customer base, while management has disclosed an estimated capital cost per Block 2 satellite between $21 million and $23 million. AST SpaceMobile also indicated that 2027 could mark the start of full commercial service, with potential for significant revenue growth depending on demand.
Buyers sustain intraday resilience amid mixed technical signals
Momentum on the D1 is mixed, with MACD signaling strong sell and ADX indicating a weak, non-directional trend. RSI is neutral near 47, Stoch RSI and CCI also reflect neutral positioning, while BBP shows buyer dominance intraday. There was a moderate gap up from the previous close ($87.09) to today’s open ($89.99), and ASTS is trading near the intraday high of $92.27, suggesting moderate volatility and persistent strength even as technical signals remain conflicted.
Bullish bias persists with defined volatility range and breakout triggers
For the next five trading days, a typical volatility band is projected between $82.00 and $98.00. The probability of an upward move is higher, with less than 20% chance of a decline, as indicated by weekly moving averages and momentum indicators. The baseline scenario is range-bound movement within this band, while a bullish breakout would require a firm move above resistance at $95.92. A bearish scenario would only emerge on a sustained fall below the SMA-20, though prevailing conditions make this unlikely.
Previously it was reported that AST SpaceMobile is experiencing persistent bearish momentum, with the price trading below its short- and medium-term moving averages and remaining above its long-term moving average, signaling ongoing selling pressure amid longer-term support. Despite new revenue generation and a TELUS partnership, technical indicators such as MACD and RSI remain firmly negative, with resistance near $96.94 and support at the MA-100 and MA-200 levels, while several oscillators reflect oversold conditions alongside elevated volatility.


Latest AST SpaceMobile News


-
 Afghanistan
-
 Albania
-
 Algeria
-
 Angola
-
 Argentina
-
 Armenia
-
 Australia
-
 Austria
-
 Azerbaijan
-
 Bahamas
-
 Bahrain
-
 Bangladesh
-
 Belarus
-
 Belgium
-
 Bolivia
-
 Botswana
-
 Brazil
-
 Brunei
-
 Bulgaria
-
 Cambodia
-
 Cameroon
-
 Canada
-
 Chile
Chile
-
 China
China
-
 Colombia
-
 Congo
Congo
-
 Costa Rica
-
 Cote d'Ivoire
-
 Croatia
-
 Cuba
Cuba
-
 Cyprus
-
 Czechia
-
 DR Congo
-
 Denmark
-
 Dominican Republic
-
 Ecuador
-
 Egypt
Egypt
-
 El Salvador
-
 Estonia
-
 Eswatini
-
 Ethiopia
-
 Finland
-
 France
-
 Georgia
-
 Germany
-
 Ghana
Ghana
-
 Greece
-
 Haiti
Haiti
-
 Hong Kong
-
 Hungary
-
 India
India
-
 Indonesia
-
 Iran, Islamic republic
-
 Iraq
Iraq
-
 Ireland
-
 Israel
-
 Italy
Italy
-
 Jamaica
-
 Japan
Japan
-
 Jordan
-
 Kazakhstan
-
 Kenya
Kenya
-
 Korea
Korea
-
 Kuwait
-
 Kyrgyzstan
-
 Laos
Laos
-
 Latvia
-
 Lebanon
-
 Lesotho
-
 Libya
Libya
-
 Lithuania
-
 Luxembourg
-
 Madagascar
-
 Malaysia
-
 Malta
Malta
-
 Mauritius
-
 Mexico
-
 Moldova
-
 Mongolia
-
 Montenegro
-
 Morocco
-
 Mozambique
-
 Myanmar
-
 Namibia
-
 Nepal
Nepal
-
 Netherlands
-
 New Zealand
-
 Nigeria
-
 North Macedonia
-
 Norway
-
 Oman
Oman
-
 Pakistan
-
 Palestine
-
 Panama
-
 Papua New Guinea
-
 Paraguay
-
 Peru
Peru
-
 Philippines
-
 Poland
-
 Portugal
-
 Puerto Rico
-
 Qatar
Qatar
-
 Reunion
-
 Romania
-
 Rwanda
-
 Saudi Arabia
-
 Serbia
-
 Singapore
-
 Slovakia
-
 Slovenia
-
 Somalia
-
 South Africa
-
 Spain
Spain
-
 Sri Lanka
-
 Sweden
-
 Switzerland
-
 Syria
Syria
-
 Taiwan
-
 Tajikistan
-
 Tanzania
-
 Thailand
-
 Trinidad and Tobago
-
 Tunisia
-
 Turkey
-
 UAE
UAE
-
 Uganda
-
 Ukraine
-
 United Kingdom
-
United States
-
 Uruguay
-
 Uzbekistan
-
 Venezuela
-
 Vietnam
-
 Yemen
Yemen
-
 Zambia
-
 Zimbabwe
- Forex
- Crypto
